


AMD Stock Price Forecast: How Will Shares Move After Acquiring AI Inference Chip Startup Taalas to Compete With Nvidia?



AI Podcast


AMD has acquired AI inference chip startup Taalas to enhance its datacenter AI portfolio, focusing on application-specific integrated circuits (ASICs) that optimize inference efficiency and reduce operational costs. This strategic move aims to bolster AMD's competitiveness against Nvidia as the industry shifts toward large-scale AI deployment. Technically, AMD's stock faces significant resistance between $490 and $500, with recent price action stalling below the 0.382 Fibonacci retracement level ($485.38). Without reclaiming key moving averages and the $504 resistance level, the stock risks retesting the $424 support zone amid limited buying momentum.

T radingkey - AMD ( AMD) announced yesterday t hat it has acquired AI inference c hip startup Taalas to strengthe n its presence in the inferenc e chip sector and further ref ine its datacenter AI product po rtfolio.
It is reported tha t Taalas was founded in 202 3 and has raised a cumulativ e total of approximately $21 9 million. As generative AI app lications accelerate implement ation, the industry's focus is gradually shifting from model t raining to model inference, nam ely, the computing process req uired for AI models to respond to user requests in actual bus iness scenarios.
Unlike gener al-purpose computing chips li ke GPUs, Taalas focuses on cus tomizing application-specific i ntegrated circuits (ASICs) as dedicated inference accelerat ors for single AI models. Thes e chips are 'hardwired' and o ptimized for specific models d uring the design phase. Althou gh their versatility is relat ively limited, they can signif icantly improve inference effi ciency and lower deployment an d operational costs.
Taala s claims its technology can ra pidly convert AI models into d edicated silicon chips. The en tire cycle, from receiving a b rand-new AI model to completi ng the corresponding hardware i mplementation, is approximate ly two months.
Currently, Ta alas's products primarily supp ort Meta's (META) Llama 3. 1 small model, while the compa ny is also developing product s geared toward larger-scale m odels. Its chips are manufactu red using TSMC's (TSM) mat ure process technology and in tegrate high-speed SRAM memor y to reduce inference latency .
AMD stated that it will i ncorporate Taalas's inference chips and related technologi es into its product roadmap in the future, developing them i n synergy with EPYC CPUs, Ins tinct GPUs, and full-system p latforms to provide customers with a more comprehensive dat acenter AI infrastructure sol ution.
Market analysts beli eve that as the AI industry g radually transitions from mod el training to large-scale co mmercial deployment, demand f or inference computing is exp ected to continue growing. AM D's acquisition of Taalas wi ll further bolster its dedica ted inference chip capabiliti es and enhance its overall st rength in competing with Nvid ia ( NVDA) in the en terprise AI infrastructure ma rket.
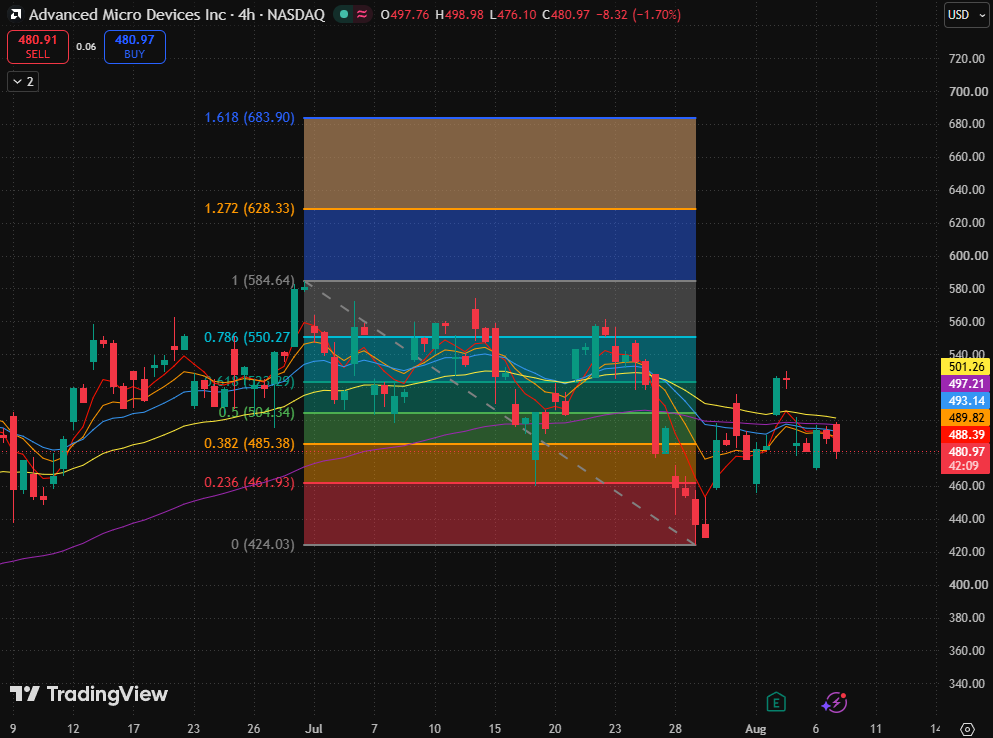
AMD 4-hour stock price chart, Source: TradingVi ew
Looking at the AMD stock price chart, after pulling bac k from its periodic high of $ 584, the share price once ra pidly dipped to around $424. Although it has rebounded fr om recent lows, it has repeat edly faced resistance in the $4 90–$500 range and has now fallen back below the 0.38 2 Fibonacci retracement level ($485.38). Near-term rebo und momentum has slowed signi ficantly, and the overall pri ce action remains in a weak r ecovery phase following the p revious sharp drop.
The cur rent price has fallen back be low major moving averages, an d the moving average system h as not yet formed a bullish al ignment. Meanwhile, although t he previous downtrend line wa s briefly broken, it has not yet successfully transitioned f rom resistance to support, re flecting that the market stil l lacks confirmation signals f or a sustained upward move.
It is worth noting that AMD' s rebound failed to break thro ugh the confluence of Fibonac ci and moving average resistan ce at $500–$504, and the l atest candlestick has fallen b ack below $485.38, indicat ing that short-term capital h as limited appetite for chasi ng high prices.
If the sto ck price falls further below t he 0.236 Fibonacci retracem ent level ($461.93), the c urrent low-level recovery wil l weaken significantly, increa sing the risk of retesting th e previous low of $424.03.
Regarding upside potential, the price needs to reclaim th e 0.382 Fibonacci retracemen t level ($485.38), followed by the 0.5 Fibonacci retracem ent level ($504.34). If it can firmly establish support a bove $504.34, the next up side target will point toward the 0.786 Fibonacci retraceme nt level ($550.27).
This content was translated using AI and reviewed for clarity. It is for informational purposes only.
Recommended Articles











Comments (0)
Click the $ button, enter the symbol, and select to link a stock, ETF, or other ticker.