


Intel Q2 2026: Revenue Up 25%, Data Center +59%, Stock Surges Then Retreats to $100



AI Podcast


Intel’s Q2 2026 results reflect a significant turnaround, highlighted by a 25% revenue increase and 59% growth in Data Center and AI segments. While a $12.5 billion non-cash CHIPS Act charge caused an $11 billion GAAP loss, non-GAAP EPS of $0.42 exceeded expectations. Despite operational progress, investor sentiment retreated due to concerns over negative free cash flow (-$8.4 billion) and aggressive capital expenditure guidance. While the company demonstrates strong core momentum, long-term stock performance depends on proving the foundry division’s path to profitability and successfully managing the high cost of capacity expansion.

TradingKey - Intel (INTC) 's second-quarter 2026 results, reported on July 23, signal a major positive turning point in their two-year recovery effort. 16.1 billion dollars in revenue exceeded estimated consensus by 12% and had a year on year growth of 25%, being the highest growth in 15 years. Revenue from the Data Center and AI division grew 59%, reaching 6.3 billion dollars, and now makes up 39% of Intel's total revenue. Non-GAAP diluted EPS was 0.42, almost double the 0.21 estimated consensus.
A large 12.5 billion dollar non-cash charge from the CHIPS Act caused a GAAP net loss of 11.0 billion dollars, substantially covering up for a lack of well-executed operations.
The stock price soared a maximum of 13% to 112.70 dollars on July 23, only to retreat to around 100 dollars by early August, as investors tried to come to terms with the increased guidance for capex, the negative free cash flow, and the remaining significant losses from the foundry. The operational progress achieved was most important, but so was the high cost of capital.
The Quarter Delivered on Multiple Fronts
The operational story from Intel's Q2 2026 earnings call and the results that are very fresh and were published on July 23, say the following. Total revenues of $16.1 billion, which is 25% more than the previous year, and over $14.42 billion from the expected Wall Street consensus, mark the highest growth in the company in over 15 years. Based on the non-GAAP measure, Intel's net income for the quarter was $2.2 billion. Diluted EPS of $0.42 was almost double the estimate consensus of $0.21. It was a positive quarter with $7.0 billion in operational cash flow.
The GAAP Story Is Different — and That's the Point
However, and particularly in this case, the GAAP story must be told. Here the story is much worse, with an $11.0 billion net loss, or $(2.16) per diluted share of common stock. Losses were driven by a non-cash mark-to-market accounting loss on escrowed shares under the CHIPS Act Secure Enclave agreement of $12.5 billion. This is an accounting charge driven by the government funding agreement and is not a closing loss for the operating business. This one-time charge must be removed to assess the quality of the earnings for the operational quarter. This is also the reason non-GAAP earnings are relevant.
Data Center Is Accelerating Fast
The segment booked $6.3 billion in revenue, a 59% year-on-year and 24% quarter-on-quarter growth. This is the fastest ramp in Xeon 6 processors, attributed to the buildout of enterprise AI infrastructure and demand for agentic AI. The segment reported $6.3 billion in revenue with $2.5 billion in operating profit, resulting in a 40% operating margin. This is where Intel is winning, proving that the demand for AI infrastructure does not only include accelerators, but also server CPUs, networking, and packaging.
Client Segment Stabilized, Foundry Progress Visible
Client Computing and Physical AI were up 13%, totaling $8.9 billion. Sales of premium AI PCs should continue to encourage Embedded’s steady growth. However, the foundry story is most convoluted. Intel Foundry’s revenue was $5.8 billion growing 31% year-on-year, but reported $2.1 billion in operating loss.
The important thing is that the loss improved by $1.1 billion compared to the prior year and the revenue from external customers was $293 million (compared to $22 million the previous year). The 18A process node is ramping, 18A-P is in risk production, and management is tracking toward 14A for high volume manufacturing in 2028. The progress is noticeable, but the losses are still massive.
Guidance Raised, Capex Raised, Cash Flow Warning
Intel estimated Q3 revenue range at $15.8 - $16.8 Billion (midpoint $16.3B Vs. consensus $15.1B), and non-GAAP EPS at $0.38. There was a lot of confidence in the Q3 guidance. That said, management increased the full year 2026 capex guidance from $18 to $20 Billion, and expects several large increases in 2027. There is no denying that the company's operational improvements are a positive development. However, foundry expansion is eating away at cash with adjusted free cash flow at - $8.4 Billion. It represented a negative valuation for a company that was up 163% year to date prior to the report.
Why the Stock Surged Then Retreated
From July 23-September 29 Intel stock went up from $100 to $112.7 (up 13%). This increase in stock price was justified and supported due to a strong earnings report with a 25% revenue beat, Data Center revenues were up 59%, and there were lower losses in the foundry. The report and findings were the cause of the plummeting stock price in the first week of August because of three investor concerns.
- First, the losses in the foundry ($2.1 billion) and the foundry growth revenues (5% of foundry revenue) indicate a lack of profitable growth in the foundry.
- Second, negative free cash flow and increasing "capex" inflows raise concerns about the investments and the financial returns.
- Third, the stock was up 163% on the year prior to the report, which means the stock price reflects most of the positive earnings news.
Wall Street made a consensus shift to neutral or hold market recommendations from overweight or buy recommendations, indicating a positive outlook on the business and earnings with concerns on the stock price.
The Technical Chart Reflects the Hesitation
Since May, a multi-month descending trendline has demonstrated resistance to all of Intel's stock's price movements. Intel's stock price has support at $97-98 (where the 50 and 100-day EMAs sit).
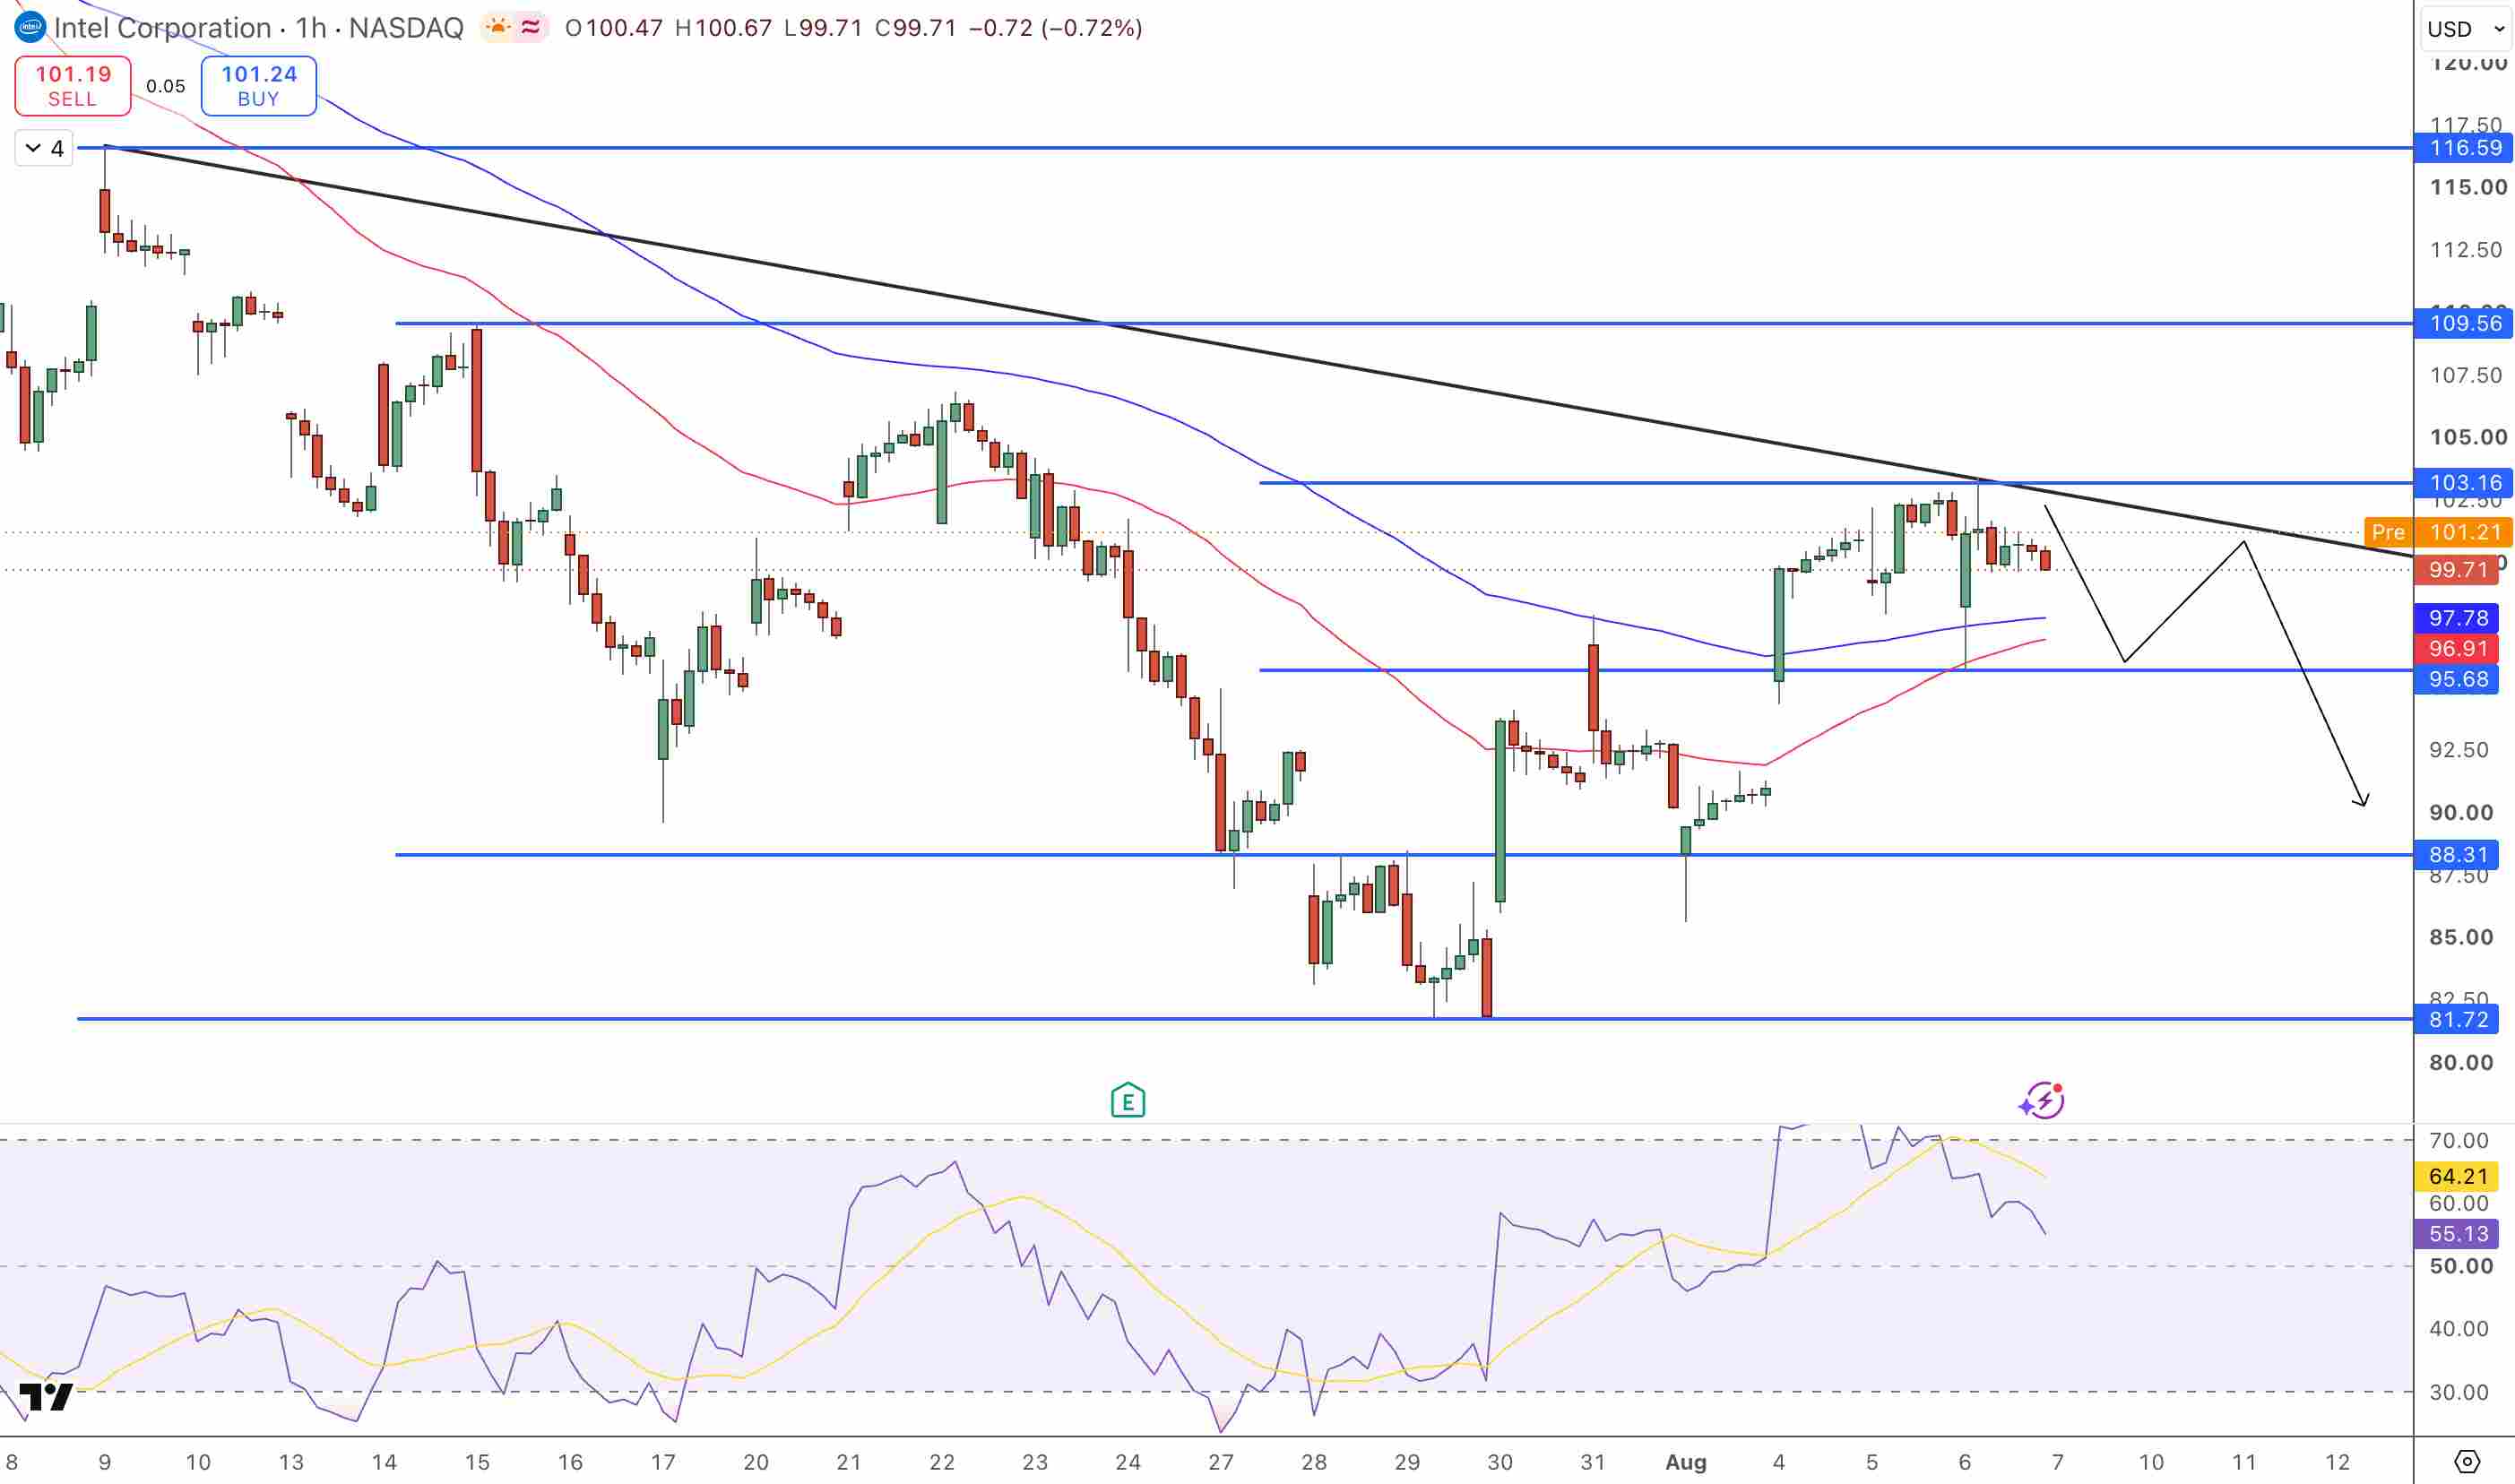
Intel Price Chart - Source: Tradingview
Resistance is at $103.16. Since the recent positive reports on the stock's movement, the RSI is at approximately 55, indicating Intel's stock is neither in an overbought nor an oversold position. The charts reinforce the fundamentals, and progress is being made.
Key Levels
- Resistance: $103.16 (descending trendline), $109.56, $116.59
- Support: $97.78 (50/100 EMA), $95.68, $88.31
- Current price: $100 (consolidating)
- RSI: 55 (neutral)
- 52-week range: $57.30–$142.35
Why did Intel stock surge then retreat?
Investors reacted positively after Intel’s quarterly earnings. Earnings were good across the board, and guidance was encouraging too. However, Intel capex spending was a huge concern. Investors were also worried about Intel’s negative Q2 foundry cash flow of -$8.4B and an ongoing $2.1B quarterly foundry loss. At 163% annual gain, a lot of good news had already been priced in. Investors have also begun asking the highly relevant question of whether increased capex spending will be counterbalanced by improved profit margins.
Is Intel stock a buy at $100?
It will depend on the individual investor’s appetite for risk and their confidence in the foundry business. Intel’s operations have improved, and the earning numbers reflect that. Revenue is up 25%, margins across the board have seen improvements, and other operational segments have seen improvements as well. However, cash flow is negative and capital expenditures are increasing, which is problematic. The trading rationale is improving Intel stock price on the assumption it will trade positively across the resistance line at $103.16 and negatively across the support line at $97.78. The price drop on the support line to $100 reflects that at the price level of $100, the stock is a buying opportunity, assuming Intel will be able to return to profitability and also improve cash flow before the end of 2027, but do your own research.
Bottom Line
The Intel Q2 2026 quarter was strong for revenue, outstanding for Data Center growth, and promising for foundry progress. The $11 billion GAAP loss was a non-cash accounting charge and not a business failure, and the 'real' numbers of the quarter were good, indicating a turnaround for a company. The metrics included a revenue growth of 25%, a non-GAAP gross margin of 41.8%, and DCAI margins of 40% with narrowing foundry losses. Stock performance will depend on the conviction of investors that the foundry will turn a profit before cash flow worsens. For Sunday readers, the quarter supports the turnaround story. The stock will move only if this story is convincing enough for a return on foundry capex.
Recommended Articles









Comments (0)
Click the $ button, enter the symbol, and select to link a stock, ETF, or other ticker.