


Corning Stock Price Forecast: Truist Says Valuation Squeezed Out After Deep Pullback; Can Shares Continue to Recover?



AI Podcast


On August 3, Eastern Time, Corning (GLW) shares rose over 6% following a Truist Securities upgrade to "Buy," citing attractive valuations after a 45% July correction. Analysts highlight strong tailwinds in the optical business, driven by AI infrastructure demand and multi-year data center contracts, projecting 30% CAGR in EPS through 2029. While technical momentum shows recovery, the stock remains in an oversold rebound phase. Sustainability depends on reclaiming the $151.62 Fibonacci level. Investors should monitor $140.38 as critical support; failure to sustain this level may signal renewed weakness despite favorable long-term fundamental guidance.
TradingKey - On August 3, Eastern Time, Corning ( GLW )'s stock price rose over 6% intraday, returning to an upward trend after experiencing a pullback of as much as 45% in July.
It is reported that Truist Securities, a well-known investment firm, upgraded Corning's rating from "Hold" to "Buy" but lowered its price target from $205 to $175.
Truist analysts stated that the core logic for the upgrade lies in the valuation returning to a reasonable level. In just-ended July, Corning's stock price experienced a sharp correction of approximately 45%.
The analysts pointed out that since they began tracking the stock in late March this year, their EPS estimates for Corning in 2028 have been revised upward by a cumulative total of approximately 30%, but the stock performance has remained largely flat. Following July's deep correction, the market has finally offered a more reasonable entry point to buy.
From a fundamental perspective, Corning's core pillar—the optical business segment, which accounts for approximately 45% of total sales—continues to enjoy extremely solid industry tailwinds. As major tech giants continue to expand capital expenditure on artificial intelligence and data center infrastructure, coupled with the steady advancement of fiber-to-the-home, Corning's order visibility in the optical network sector has significantly improved. Furthermore, the company's photonics MAP initiative is expected to continue contributing incremental revenue by the end of this decade.
The firm expects that driven by strong growth in the optical and solar businesses, these two segments will drive the company's overall revenue growth by 18% by 2028. Meanwhile, Corning is increasingly signing multi-year, long-term supply agreements with hyperscale data center customers, securing its future cash flows.
The firm forecasts that from now until 2029, Corning's earnings per share (EPS) will grow rapidly at a compound annual growth rate of 30%. With further expansion of operating margins and return on invested capital (ROIC), the company is expected to further raise its long-term financial performance guidance later this year.
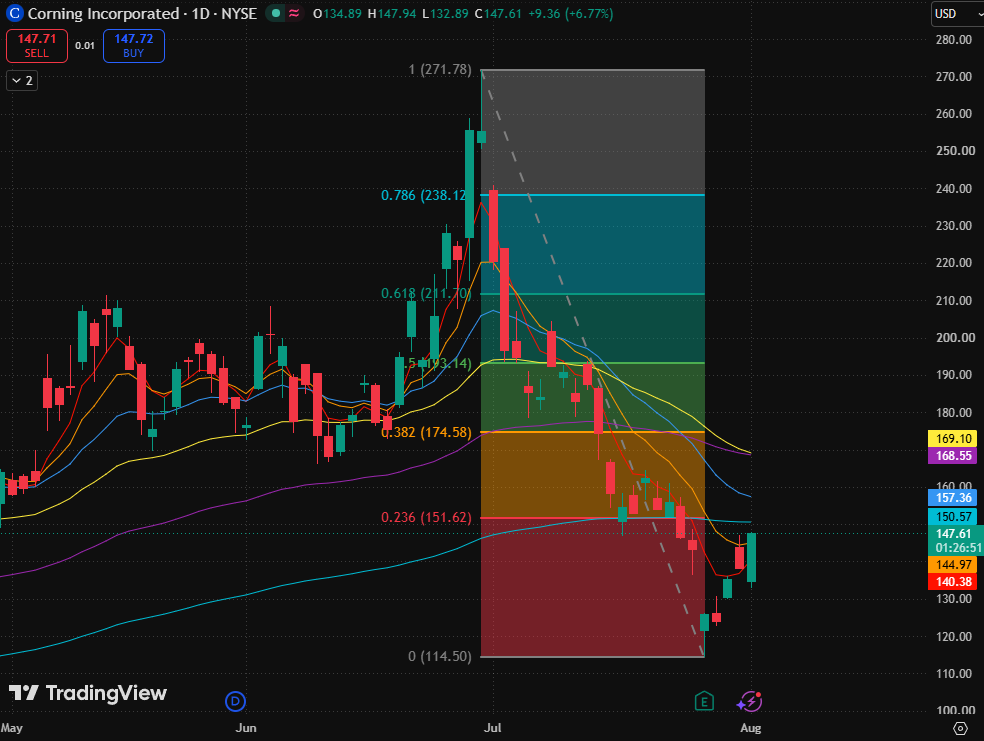
Corning Stock Chart, Source: TradingView
Corning's latest price is around $147, showing a strong recovery from its recent low on July 28 ($114.5). However, despite the strong rebound, the stock price remains below the 0.236 Fibonacci level ($151.62) and has not fully reclaimed the short-to-medium-term moving average resistance zone. Currently, this should be viewed as a technical rebound after an oversold condition, with a trend reversal still awaiting confirmation.
Looking at moving averages, the stock price has climbed back above the short-term moving averages near $140.38 and $144.97, showing some improvement in short-term momentum. However, it still faces multiple moving average resistances above at $150.57, $157.36, and $168.55–$169.10. If the stock fails to break through $151.62 on high volume in the future, the sustainability of the rebound will remain limited.
In terms of upside, if it effectively breaks out and holds above $151.62, the next level to watch is $157.36, with stronger resistance situated at $168.55–$174.58, where $174.58 corresponds to the 0.382 Fibonacci retracement level.
If the rebound fails and drops below $140.38, market confidence in this low-level rebound will be significantly weakened, and attention should return to the validity of support near $132 and the $120 area below.
Only if the daily chart consistently holds above $151.62 and gradually reclaims the resistance above $157.36 can the movement be further defined as a trend improvement rather than just a "technical bounce".
This content was translated using AI and reviewed for clarity. It is for informational purposes only.
Recommended Articles










Comments (0)
Click the $ button, enter the symbol, and select to link a stock, ETF, or other ticker.