


Netflix (NFLX) Stock Forecast: 23x P/E, $94 Target, Testing Trendline at $73



AI Podcast


Netflix reported Q2 2026 earnings with an EPS of $0.80, exceeding expectations, alongside 13% revenue growth to $12.56 billion. Despite strong financials and a $4.7 billion share repurchase, shares faced pressure due to Q3 revenue guidance of $12.86 billion, missing consensus by $140 million. Concerns persist regarding stagnating subscriber growth and slowing viewing hours. However, analysts maintain a bullish outlook with an average price target of $94.33, citing an attractive P/E of 23.41 and scaling advertising revenue. Technically, the stock is testing resistance at $73.70; a breakout could signal further gains toward $78.30.

TradingKey - On Wednesday July 30, Netflix (NASDAQ: NFLX) was trading at $73.63. The stock's 52-week range is $65.08 to $126.71. Netflix stock has been in consolidation since July 16 when Q2 2026 results came out. The results posted an EPS of $0.80, beating the consensus estimate of -$0.33 by $1.13. Netflix guidance for Q3 revenue was $12.86 billion, coming in $140 million under the $13.0 billion estimate. The initial post earnings impact took NFLX down to $65 from $67 but the stock has since recovered.
NFLX is currently at a descending trendline resistance at $73.70 with RSI of 59 and is moderately approaching the overbought zone. The average price target is $94.33. The stock is seen as a value play post-Q2 per TipRanks and with a P/E of 23.41. On July 22, Baird lowered their price target from $120 to $90. Further, Netflix refinanced debt with the issuance of $1 billion in senior notes.
The Q2 Results and Why the Stock Sold Off Despite Beating EPS
On July 16, Netflix reported Q2 2026 results and posted an EPS of $0.80 versus the consensus of -$0.33, beating consensus by $1.13. The reported revenue came in at $12.56 billion, growing 13% year on year. Q2 2026 Operating income was $4.19 billion, yielding an operating margin of 33.4% and free cash flow of $1.5 billion.
Netflix executed the largest share repurchase program to date, repurchasing $4.7 billion of the stock. Revenue from all regional segments posted double digit growth year on year. EMEA was the first region to surpass the $4 billion revenue mark. The number of paid subscribing members surpassed the milestone number of 325 million in 2026. Year on year ad revenue is expected to grow to $3 billion, approximately a 100% growth from the prior year.
The stock selloff was not helped by the guidance update following the EPS beat. Netflix set the expectation for Q3 revenues to be $12.86 billion, which is $140 million shy of the $13.0 billion consensus. While this is 13% growth from last year, the guidance miss added to the investor concerns that the membership and pricing benefits that propelled Netflix to outperform in the first half of the year are starting to wane. The year on year viewing hours for the first half of the year increased by a mere 2%, which is a concerning drop from the levels of growth Netflix has seen in 2023 and 2024 in the double digits.
The plateau of audience engagement has also been acknowledged by Netflix management and is a driving factor behind Netflix’s increased focus on live events and an overall increase in the content budget, despite live events only currently accounting for a small fraction of the overall content budget.
Why Analysts Are Still Bullish at $73
Analysts are in nearly unanimous agreement that Netflix is a Buy. There are no Sell ratings, and 36 analysts contributed to this number. $73 is below the expected price of Netflix, which is $94.33, a 28% increase. There are three supporting arguments in favor of this value. There is a strong argument to be made that the 23.41 P/E ratio is a discount when compared to Netflix’s own streaming competitors. Following Q2, TipRanks categorized Netflix as a value stock, a characterization that is especially humorous when compared against the price of $126.71 just a few months ago.
Second, Netflix is in the process of scaling their advertising system, and it is projected to reach $3 billion of ad revenue in 2026. Third, conservative estimates of the full year 2026 suggests total revenue of $51.0 to $51.4 billion and would yield an operating income of approximately $16 billion, which represents a significant value of equity.
Baird adopted a more cautious approach and dropped their price target to $90 from $120 on July 22. Baird argued that slower subscriber growth, coupled with a 2% growth rate in viewing hours, demonstrates Netflix is losing momentum in engagement, even as the financial metrics are strong. On July 22, Netflix issued senior notes in the amount of $1 billion to refinance existing debt. This was a neutral operational move, but affirmed that Netflix is actively managing their position against the $14.3 billion gross debt.
Netflix (NFLX) Technical Setup
When viewing the 4-hour chart with NFLX priced at $73.63, we can see the stock is testing a descending trend line at $73.70. The stock has pushed up and over the 50-period EMA, which is currently sitting at about $71.50. At an RSI of 59, the indicator is looking bullish and is not close to the overbought region. If we see a confirmed daily close above $73.70, we can expect a bullish extension to $75.70 and then to $78.30.
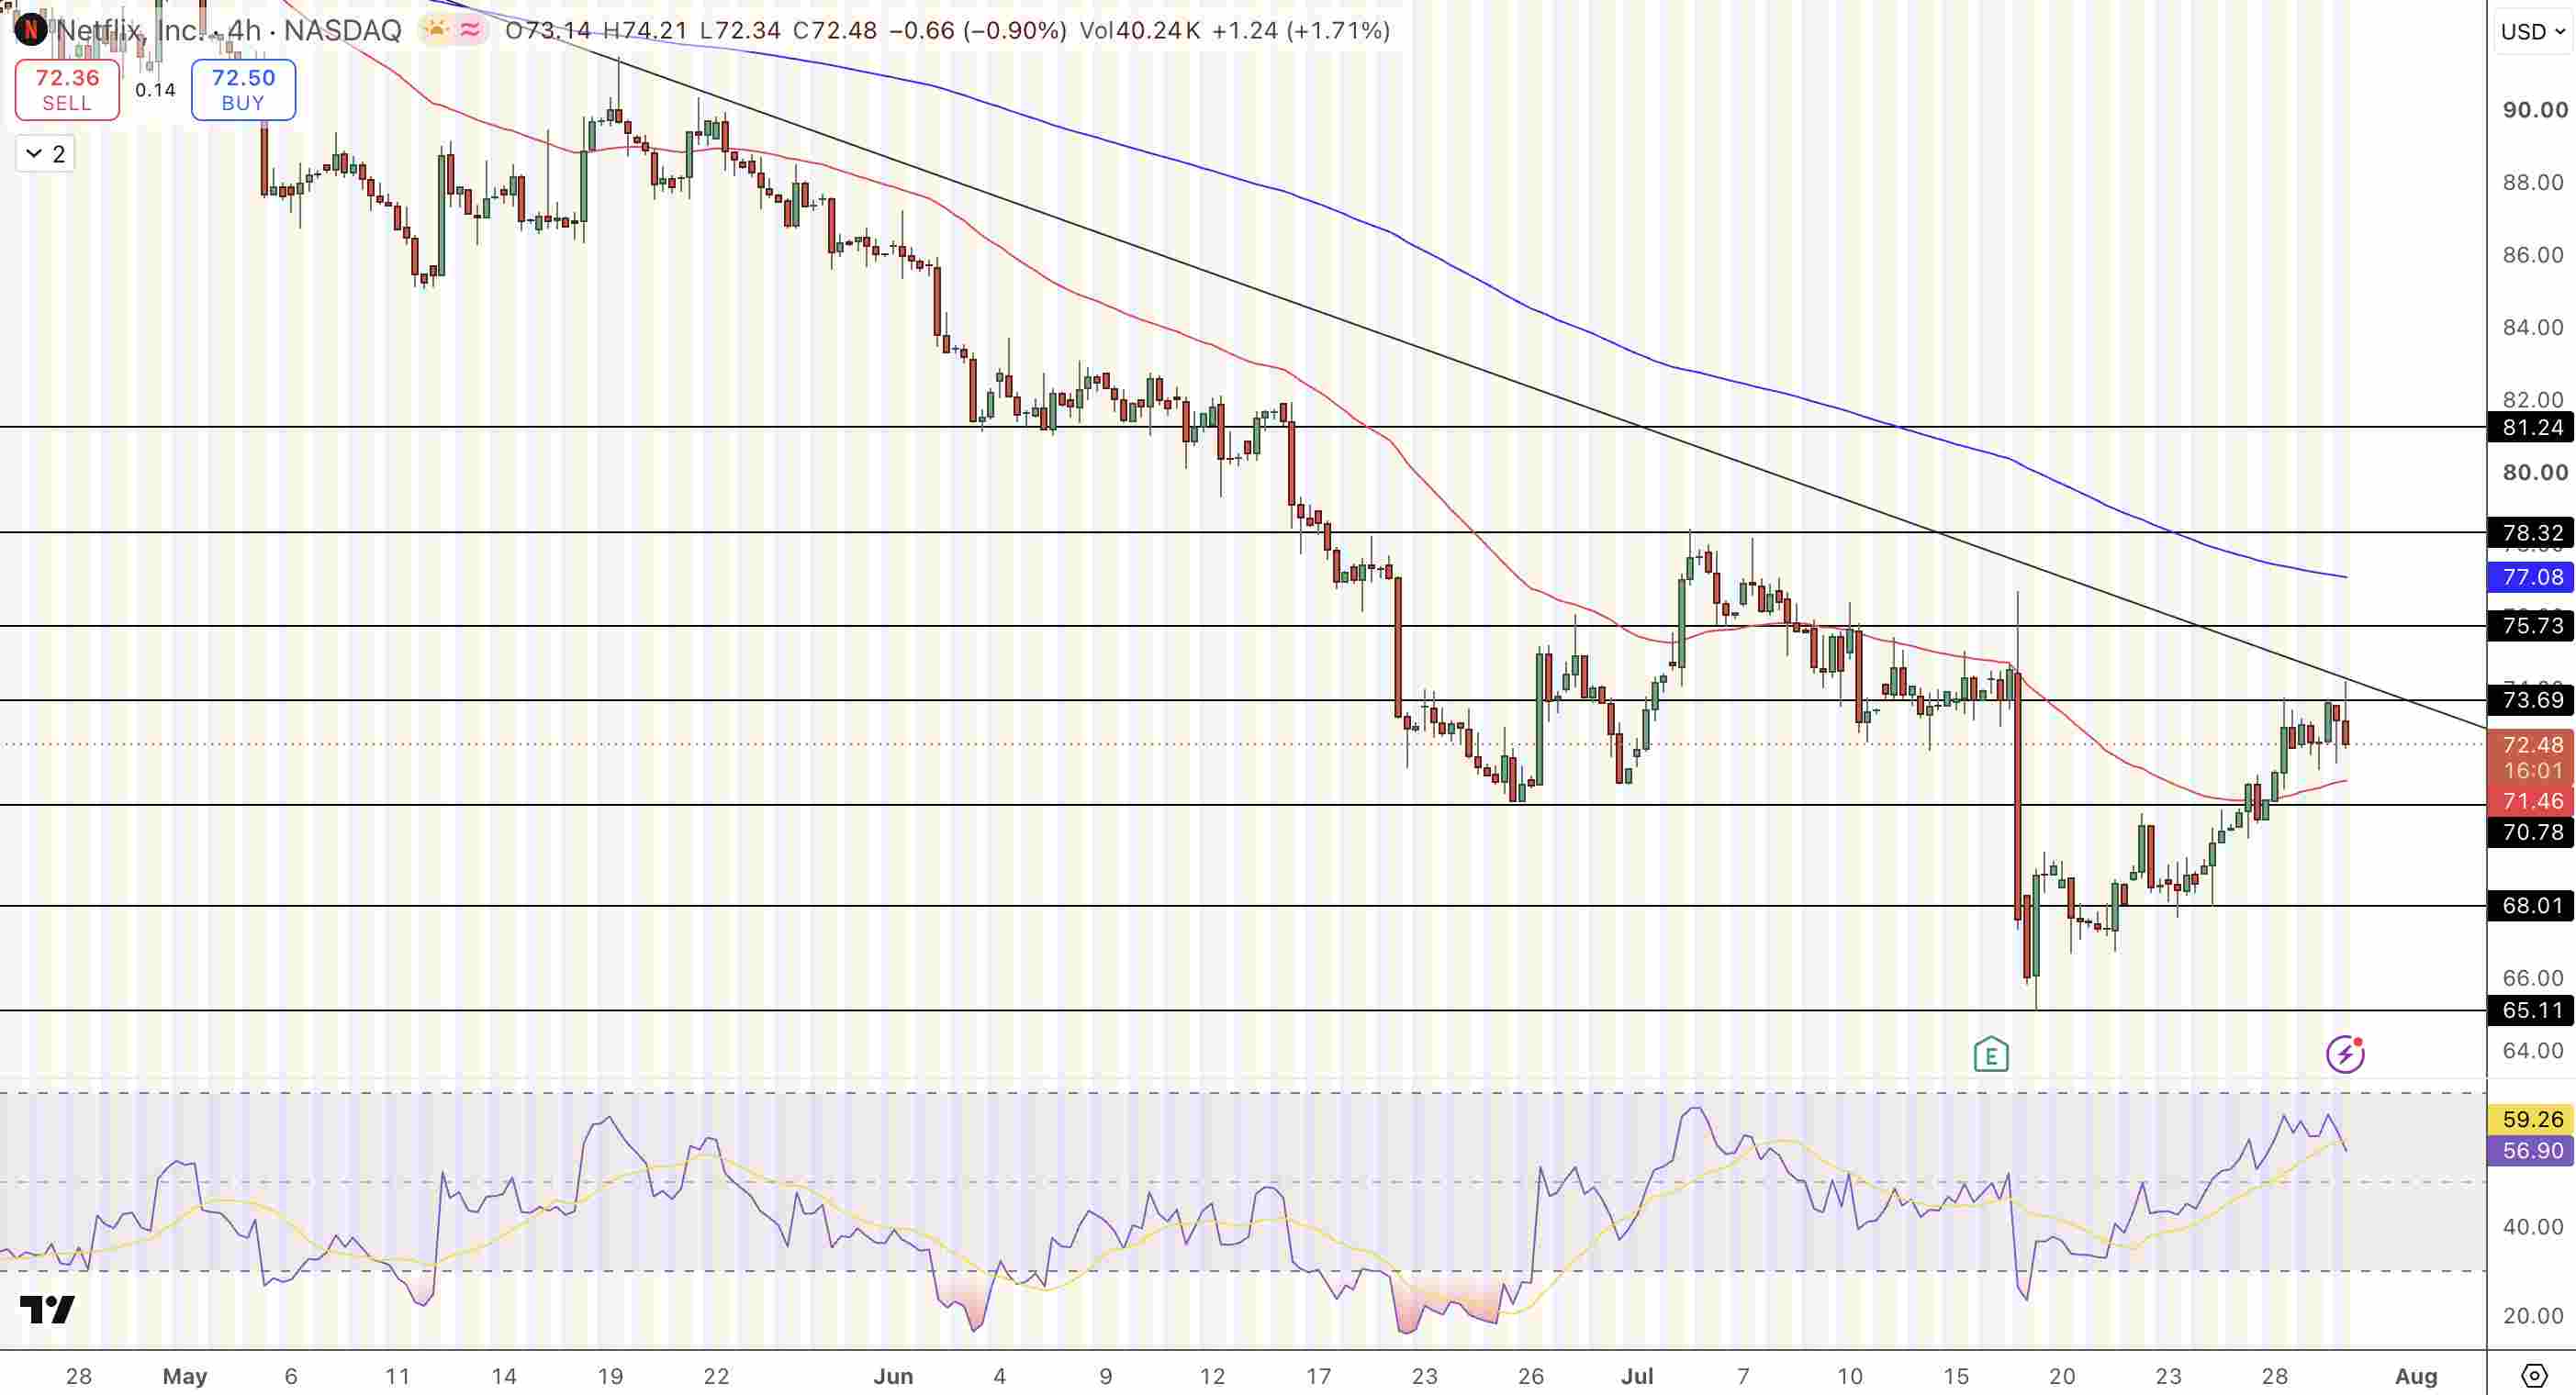
Netflix (NFLX) Stock Price Chart - Source: Tradingview
If we drop below $71.50, we can expect the next support to be at $70.80 and below that at $68.00. In the medium term, the $77.10 area which is the 200-period EMA will be a critical resistance for the bulls to breach and reverse a trend for the stock.
Key Levels
- Current Price: $73.63, Today's Range $71.75-$73.74, 52-week Range: $65.08 - $126.71
- Q2 Revenue: $12.56B (+13% YoY), EPS: $0.80 (beat est. by $0.33), FCF: $1.5B, Op Margin: 33.4%
- Q3 Guidance: $12.86B, $13B Consensus (missed by $140M), FY: $51.0-$51.4B
- Ad Revenue: ~ $3B Ad Revenue in FY26 (doubling YoY), 325M+ paid memberships
- Debt: $1B senior notes issued July 22 to refinance, $14.3B gross debt
- Analyst Target: Avg. $94.33 (36 Buy, 0 Sell), Baird $90, High $135, Low $70
- Trendline: Resistance at $73.70, Support at $71.50 (50 EMA), $70.80, $68.00
Why Did Netflix Fall After Beating Q2 EPS So Significantly?
Netflix reported an EPS of $0.80 vs. Consensus of -$0.33 (one of the largest positive EPS surprises in recent quarters from a major streaming company); however, the focus was on the Q3 Guidance and not the Q2 numbers. Revenue Guidance for Q3 was $12.86B, $13B Consensus (missed by $140M) and at a 13% Q3 Growth, the Guidance is indicative of a deceleration in growth vs. the H1 results.
Additionally, viewing hours grew by a mere 2% in H1, which is significantly below the growth rates of prior years, and the market interpreted that the recent price hikes to the ad supported tier as well as the recent growth in memberships, have stagnated.
Is Netflix Worth Investing At $73?
Netflix's P/E ratio sits at 23.41 with a projected price of $94.33 by analysts, making Netflix appear undervalued. To put this in perspective, the P/E ratio of Netflix during 2020-2021 was in the 50-70 range. Now, with a P/E ratio at 23, Netflix sports a 33% operating margin and a predicted free cash flow of $12.5 billion. Adding in the fact that the advertising portion of Netflix is growing quickly, the value case for Netflix is clearly there. The bearish argument stems from the fact that 23x is not cheap.
The bearish argument is that the earnings growth will slow down after 2024-2025 with subscriber growth capped at 325 million, with further price changes resulting in lower returns. Baird sets Netflix's price target at $90 to be cautious of the slowdown in growth, while still forecasting improvement from $73.
The Bottom Line
Netflix is currently at $73.63, with a declining target of $73.70, after the posts-Q2 sell off that saw the stock price go from $126.71. The company reports $12.56 billion in revenue for Q2 with a 13% increase, a Q2 operating margin of 33.4%, and an announced $4.7 billion in quarterly buybacks, with advertising revenue near $3 billion. Although guidance for Q3 is lower by $140 Million, investors must recognize that at a P/E of 23, with a price target of $94.33, and 36 Buy ratings, the stock is undervalued. The Relative Strength Index (RSI) is at 59. A close at the trendline of $73.70 will set a price target of $75.70 and $78.30, while $71.50 indicates a hard support of $68. The $94 price target was set because the guidance of $140 million appears overly pessimistic.
Recommended Articles










Comments (0)
Click the $ button, enter the symbol, and select to link a stock, ETF, or other ticker.