


Why Is Meta (META) Crashing After Earnings? EPS Missed 14%, FCF Hit $784M, Capex Raised Again



AI Podcast


Meta Platforms (META) shares declined 9.64% in after-hours trading on July 29, following a Q2 2026 earnings miss. Despite revenue growing 28% to $60.8 billion, EPS of $6.18 missed consensus by 13.8% due to high legal and severance charges. Free cash flow plummeted to $784 million as capital expenditures surged to $31.1 billion. Management raised full-year capex guidance to $130–$145 billion, while Q3 revenue guidance fell below market expectations. Investors remain concerned about the lack of clear return-on-investment justification for heavy infrastructure spending, with technical support currently tested at the $521.50 level.
TradingKey - Meta Platforms (NASDAQ: META) closed Tuesday July 29 at $585.61, then fell 9.64% in after-hours trading to $529.15 after reporting Q2 2026 results that beat on revenue but missed badly on earnings. Revenue of $60.8 billion grew 28% year-on-year and beat the $60.19 billion consensus. EPS of $6.18 missed the $7.17 consensus by 13.8%. Free cash flow collapsed from $8.5 billion a year ago to $784 million as $31.1 billion in capex almost entirely consumed $31.9 billion in operating cash flow. Meta raised the lower end of its full-year capex guidance to $130 billion to $145 billion and Q3 guidance of $61 to $64 billion came in below the $63.2 billion Wall Street had been modeling.
The Three Numbers That Are Moving the Stock
The headline figure is the 13.8% EPS miss, but the more important story is how EPS came to be $6.18. This was the result of three large, one-off, and abnormal charges that EPS was burdened with. Legal proceedings charges were $2.4 billion and $1.18 billion in capex reduction charges were incurred from a reduction of the workforce of about 8,000 employees. Costs and expenses increased by 55% to $42.03 billion.
As a result, operating margin suffered, reducing by 12% to 31%. Net income also fell by 14% to $15.85. The advertising revenue segment was unaffected by this, as FB experienced a 14% year-on-year increase in ad impressions, and average ad prices grew by 12% year-on-year.
The collapse of free cash flow (FCF) from $8.5 billion to $784 million is the main concern for the majority of analysts. Meta generated $31.9 billion in operating cash flow, but this was mostly consumed by capital expenditures of $31.1 billion. Meta has now increased capital expenditure guidance twice for 2026, first from under $100 billion to $125 to $145 billion and now to $130 to $145 billion for the lower bound.
This is a pattern that resembles Alphabet, which is making a large capital infrastructure investment, which is resulting in negative or near negative free cash flow, while revenue grows by 28%. An already disappointing guidance range for Q3 of $61 billion to $64 billion with a midpoint of $62.5 billion (below $63.2 billion consensus) created a double negative signal for near term revenue deceleration and deteriorating earnings quality for the current quarter.
What Was Good in the Report
Advertising fundamentals are strong and evidenced by $60.8 billion in revenue which grew by 28% due to a 14 percent and 12 percent growth in ad impressions and in average ad price, respectively. Meta's family daily active users (DAUs) grew by 3% year-over-year to reach 3.60 billion. Daily active users of Instagram reached 2 billion and Threads reached a half Billion monthly active users, making it the fastest growing conversation app in history per Zuckerberg.
WhatsApp set a record for the Finals in the World Cup by sending 30 million messages per second. Though Reality Labs grew by 16% and reported revenue of $431 million, the operating loss remains a burden for the division and was reported at $4.62 billion.
Meta also revealed the $14 billion El Paso data centre project, with funding primarily by BlackRock (who owns 80% of the facility). The structuring is very tactical, as this would minimize Meta’s balance sheet exposure (and risk) while yet allowing them access to the AI Infrastructure.
The outstanding cloud computing deal with Anthropic, where Meta is expected to provide $10 billion of AI compute (over a two-year period), will further make this transition a positive cash flow one, as opposed to a capital expenditure. None of the above deals have been factored into the $130 to $145 billion capex limit. Hence, if both the Anthropic and BlackRock deals proceed as expected, they could further minimize Meta’s free cash flow position beyond the projected estimates.
Microsoft Showed What a Good Hyperscaler Earnings Looks Like
There is a lot to learn from the Microsoft Q4 FY2026 numbers released the same night. Microsoft beat on EPS and revenue with Azure up 27% for the quarter and with an impressive commercial backlog leading the stock to trade up the next day. Microsoft somehow managed to increase capex while convincing the market of the company’s free cash flow. The main difference is in the quality of disclosure.
Microsoft explained that its FY2027 capex of $255 billion to $260 billion is demand-driven with the example of specific Azure capacity with Cloud margins increasing from 17.8% to 36% in two quarters. Meta provided no such demand justification and thus no return rationale for the increased capex. Where such demand justification is absent, the quality of spending, not the quantity, determined the market’s response.
META Technical Setup
Following the close of META at $585.61, the after-hours trade showed $529.15, to trade in the Wednesday session at $543. Trading in META is quickly approaching the $521.50 double-bottom support zone, the most important technical level in the charts.
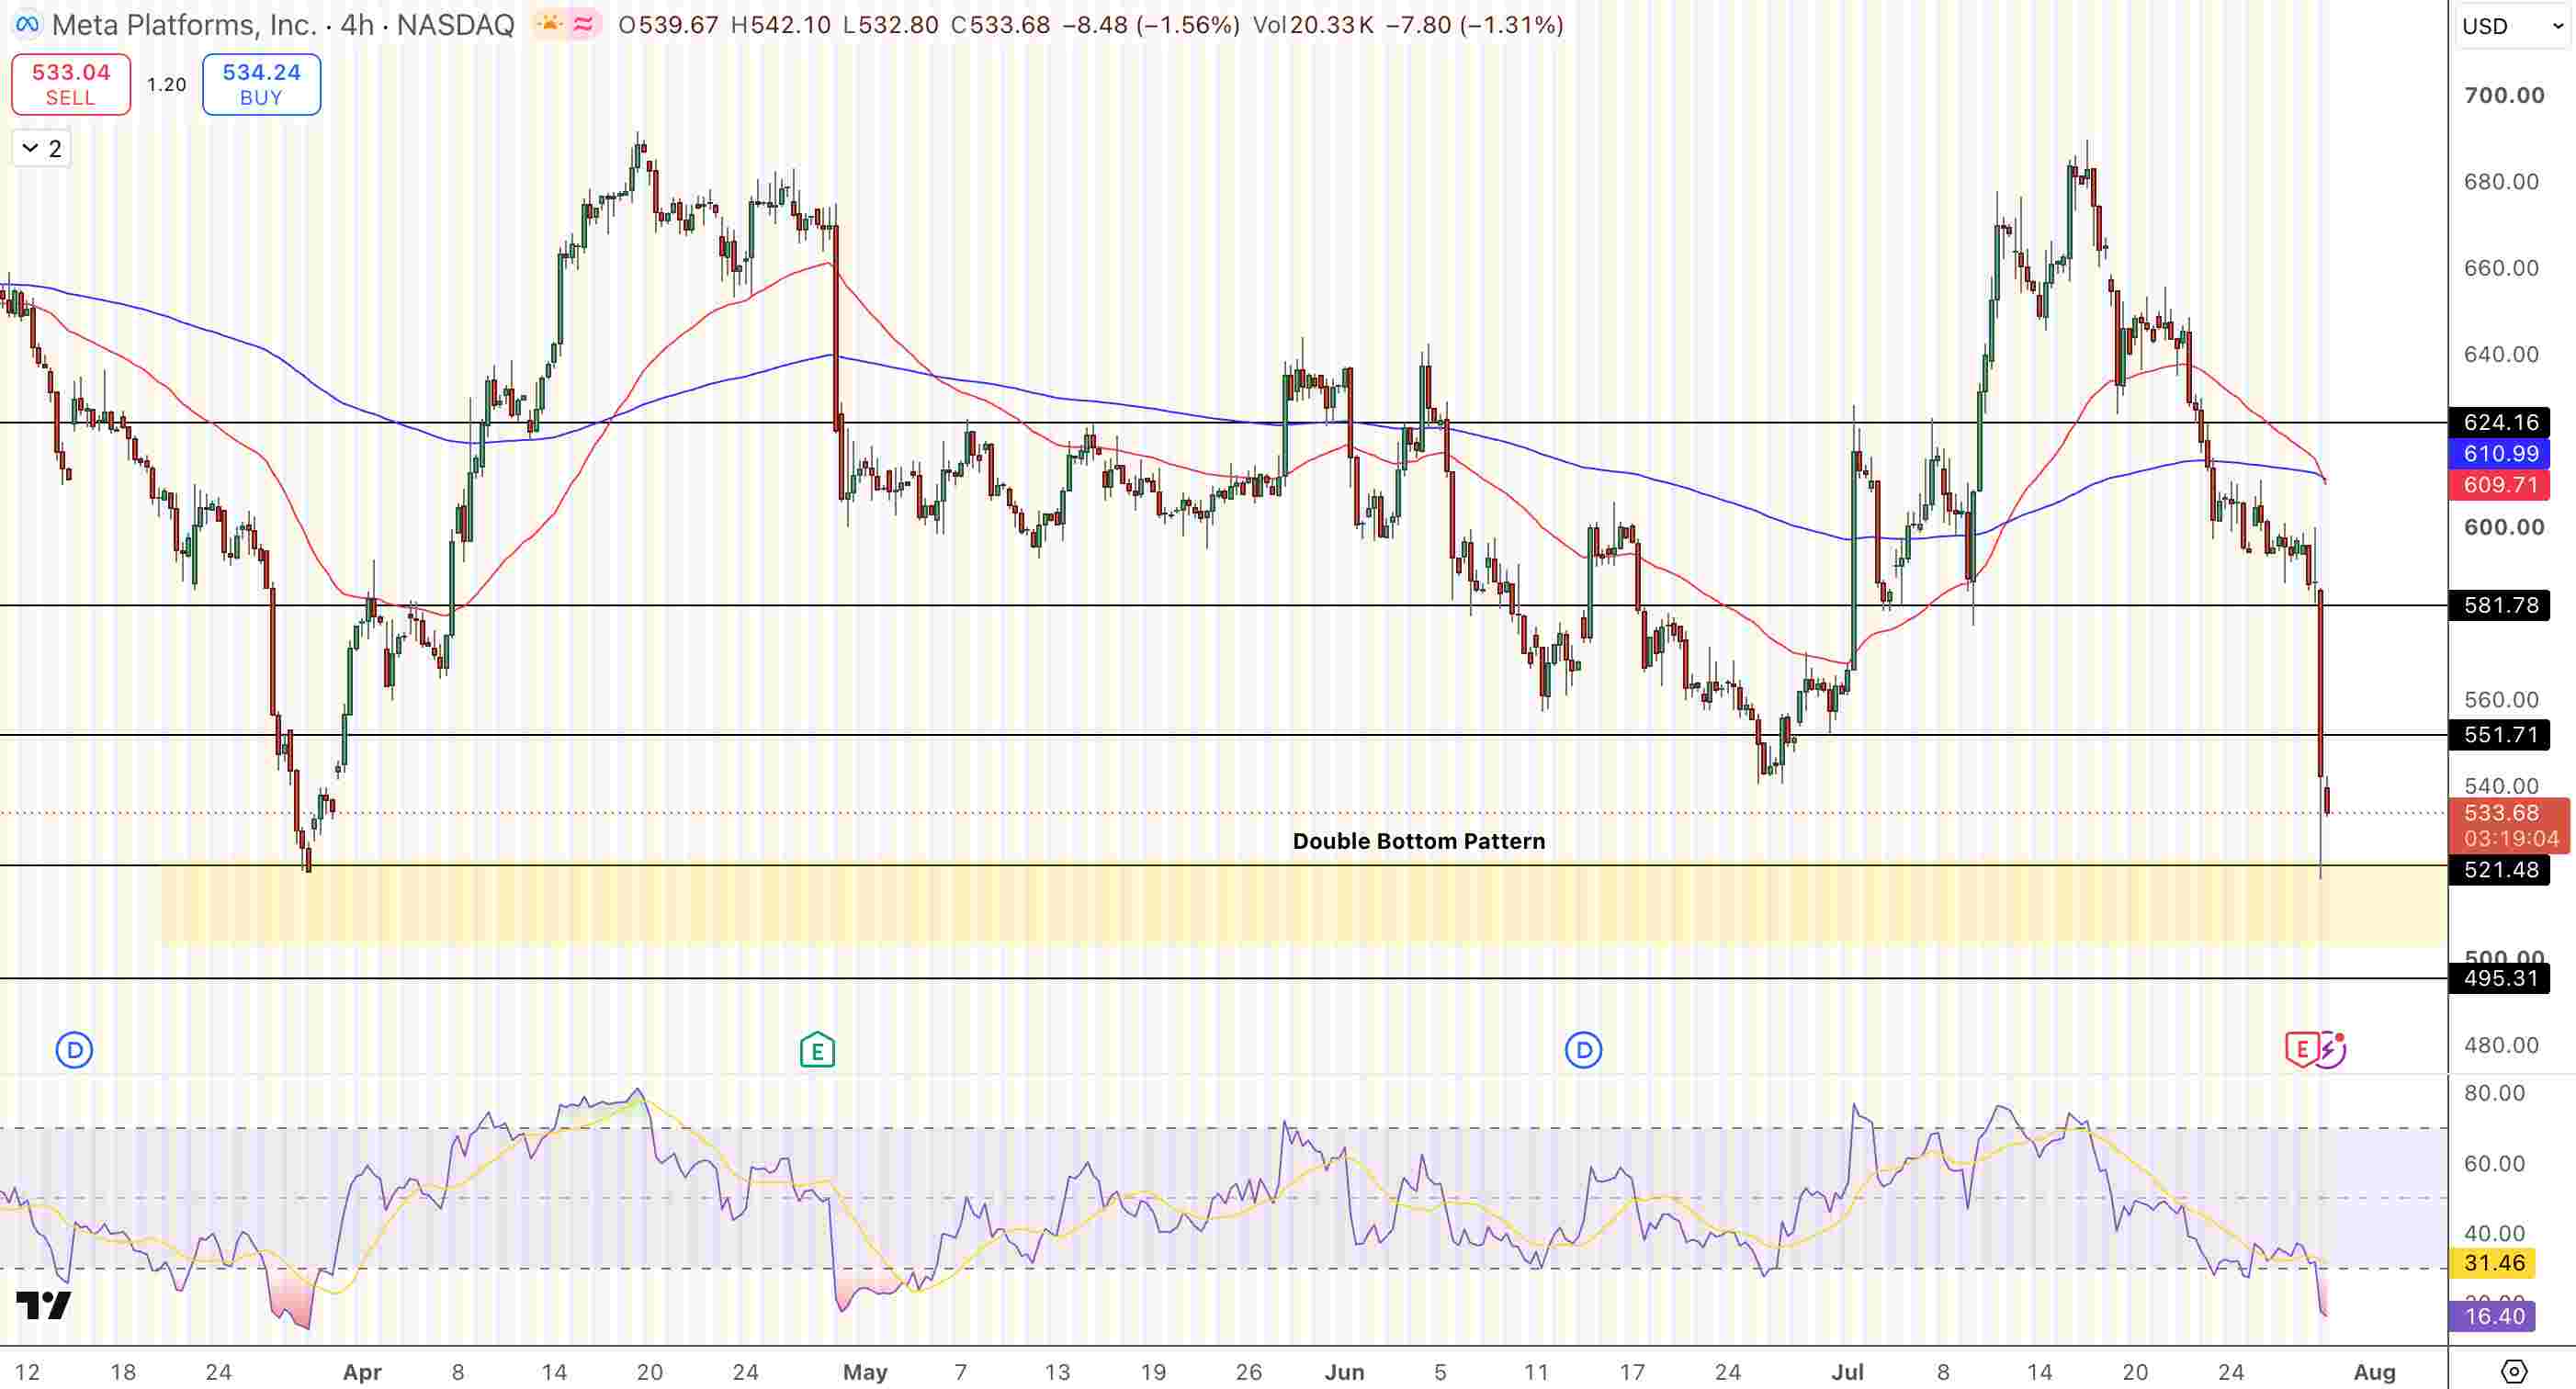
Meta (META) Price Chart - Source: Tradingview
The RSI at 16 is extremely oversold and the lowest its been since the 2022 sell off. A hold above $521.50 with a bullish candlestick could lead to short covering to $551.70 and $581.80. A close below $521.50 leads to $495.30 with both the 50 ($609.70) and 200 ($611) period EMAs acting as resistance.
Meta’s Key Levels
- After-hours: $529.15 (-9.64% from $585.61 close). Overnight $543.47 (-7.20%)
- Q2 revenue: $60.8B (+28% YoY, beat $60.19B). EPS $6.18 (missed $7.17 by 13.8%)
- FCF collapse: $784M vs $8.5B a year ago. Capex $31.1B of $31.9B operating cash flow
- Capex raised: $130-145B full year (raised from $125-145B). BlackRock $14B El Paso venture
- Q3 guide: $61-64B revenue. Midpoint $62.5B below $63.2B consensus
- Double bottom: $521.50 critical support. RSI at 16. Below: $495.30
- Resistance: $551.70, $581.80, $609.70 (50 EMA)
Why Did Meta Beat Revenue But Still Fall 10%?
Meta's revenue grew 28% YoY to $60.8 Billion, beating expectations by $600 Million. Meta's EPS of $6.18 came in below the $7.17 consensus by 13.8%. The EPS miss was due to $31.1 Billion in quarterly capex, $2.4 Billion in legal costs, and $1.18 Billion in severance costs.
Free cash flow decreased severely, coming in at $784 Million vs $8.5 Billion the year before, as Meta's infrastructure investments continued to eat up almost all of their operating cash flow.
Meta's Q3 guidance of $61 to $64 Billion revenues was below the $63.2 Billion expectation. This situation is quite similar to how the market reacted to Alphabet's post earnings report.
What Is the $14 Billion BlackRock El Paso Data Center Deal?
Meta and BlackRock are partnering on a $14 billion artificial intelligence data center facility in El Paso, Texas, where BlackRock funds own 80% of the center. This partnership enables BlackRock funds to provide both debt and equity financing while Meta is given the opportunity to lease compute for many years.
Because of the design of the partnership, BlackRock will provide compute and infrastructure financing to Meta without Meta having to make significant capital expenditures or adjustments to the balance sheet.
This partnership is similar to the reported leases of $10 billion of compute that Meta is negotiating with Anthropic. It is likely that a number of partnerships similar to this are going to be required to adjust the Meta capex guidance.
Bottom Line
Meta stock dropped 9.64% after the second quarter due to earnings of $6.18, missing estimates by 14% with free cash flow falling to $784 million, an increase in capex guidance to a range of $130 to $145 billion, and an estimated third quarter EPS lower than the consensus estimates. The Meta advertising business continues to grow, with revenue increasing by 28% with impressions and prices increasing by 14% and 12%, respectively.
Meta is trading at an RSI of 16 and is viewed as extremely oversold with the critical support level of the stock at $521.50. The first bullish signal would be a recovery above $551.70. In the same evening Microsoft reported its earnings, its stock was positively adjusted. The market can differentiate between capex and rate of return from hyperscalers and other accelerated capex.
Recommended Articles








Comments (0)
Click the $ button, enter the symbol, and select to link a stock, ETF, or other ticker.