


IBM (NYSE: IBM) Stock Recovery: Bouncing From $201 Toward 50 EMA After Q2 Reset



AI Podcast


IBM shares recovered to $226.90 on July 28 following a record 25.2% decline in July. Q2 results confirmed $17.16 billion in revenue and $2.93 EPS, with software growth of 5% offsetting a 42% decline in mainframe infrastructure. Management projects 4-5% annual revenue growth and improved margins. However, an ongoing securities fraud investigation regarding pre-warning disclosures remains a significant regulatory overhang. Technical recovery is underway, with the 50-period EMA at $233.20 serving as critical resistance. Sustained institutional re-entry depends on both operational execution and a formal resolution of the legal inquiries.
TradingKey - International Business Machines (NYSE: IBM) rose 5.62% on Monday July 28 to around $226.90 after trading down to around $201.60 following the July 22 full Q2 report. The stock had traded up to $306 in early July but the July 14 preliminary Q2 warning led to the worst single-day drop ever of 25.2%. The full Q2 results were released on July 22 confirming what had been seen in the preliminary Q2 report: Revenue $17.16 billion (+1% YoY), Adj. EPS $2.93, and full year guidance for 4% to 5% constant currency revenue growth. The Software division saw 5% growth to $7.76 billion. Revenue for the Mainframe business dropped 42%. The securities fraud investigation continues. RSI has returned to 65, getting dangerously close to overbought territory as the stock tests the 50-period EMA at $233.20.
What the Full Q2 Results Confirmed
The July 22 full earnings release confirmed the numbers disclosed in the preliminary July 14 report, showing revenue of $17.16 billion vs. the $17.58 billion consensus and adj EPS of $2.93 vs. $2.97 consensus. The detail that altered the market’s post-earnings reaction was in the segment breakdown. The Software division, which is IBM’s highest-margin business, brought in $7.76 billion, 5% growth year on year.
Hybrid Cloud, largely Red Hat OpenShift, brought in revenue that increased 11% year on year; OpenShift annual recurring revenue was $2.2 billion. Data revenue grew 19%, boosted by demand for AI-related analytics. Consulting revenue was $5.33 billion, essentially flat, but new signings grew 6% for a second consecutive quarter; generative AI accounted for approximately 50% of all signings and over 30% of the consulting backlog, a major indication of a change to how IBM sells services, incorporating AI into its offerings.
The weakness came from infrastructure. Revenue fell 7% to $3.84 billion, and Z mainframe revenue fell 42%, which reflects the timing of the product cycle after a period of strong revenue. IBM announced during the quarter a letter of intent to build a US quantum chip foundry, a move that expands the scope of IBM’s manufacturing ambitions and aligns with the company’s long-standing multi-year investment in quantum computing that has already topped $10 billion.
The company’s guidance for full year 2026 is for 4% to 5% constant currency revenue growth, roughly $1 billion in free cash flow year on year, and roughly 100 basis points of improvement in operating pre-tax margin through productivity initiatives. The quarterly dividend is $1.69 per share.
The Securities Investigation - What Remains Unresolved
The securities fraud investigation launched in the wake of the July 14 price collapse is ongoing. The question under investigation is whether IBM misled the market about the strength of its deal pipeline in advance of the July 14 preliminary Q2 warning. IBM management’s answer in the July 22 full earnings release was that enterprise customers reallocated their spending towards AI hardware at the expense of IBM’s software and consulting businesses.
However, the issue is whether IBM management knew that its pipeline was less robust than the company’s statements had suggested before July 14. No formal charges have yet been laid. The existence of the investigation adds ongoing regulatory risk that limits how far the market allows the stock to recover until there is a resolution, even though the fundamental outlook is better now with the revised full year guidance of 4% to 5% revenue growth.
IBM’s 5.62% gain on Monday July 28, part of a general rotation out of semiconductor names into other technology stocks, helped lift IBM from $201.60 towards $226.90. The $306 high in July represents a 35% gap that needs to be closed. But that requires IBM to demonstrate continued business success, and also to resolve the securities investigation. Without those two things, institutional investors that sold off in the aftermath of the July 14 crash won’t have the confidence to re-enter positions at scale.
The $233.20 50-period EMA is the next significant level of resistance. There hasn’t been a successful rally since the July 14 crash that has reached the levels of support in place before the crash. A close above the 50-period EMA would indicate that the current rally has transitioned from a dead cat bounce.
IBM Technical Setup
IBM bounced off $201.60 support with a higher highs and higher lows towards $226.90. RSI was near 65 overbought zone post deep oversold recovery. 50EMA $233.20 is the immediate resistance, followed by $245.50, 200EMA $249.70, and $255.70. Next support below $213.30 is $201.60. Any close below $201.60 exposes $188.80. Recovery is constructive but needs a close above 50EMA and hold to be confirmed.
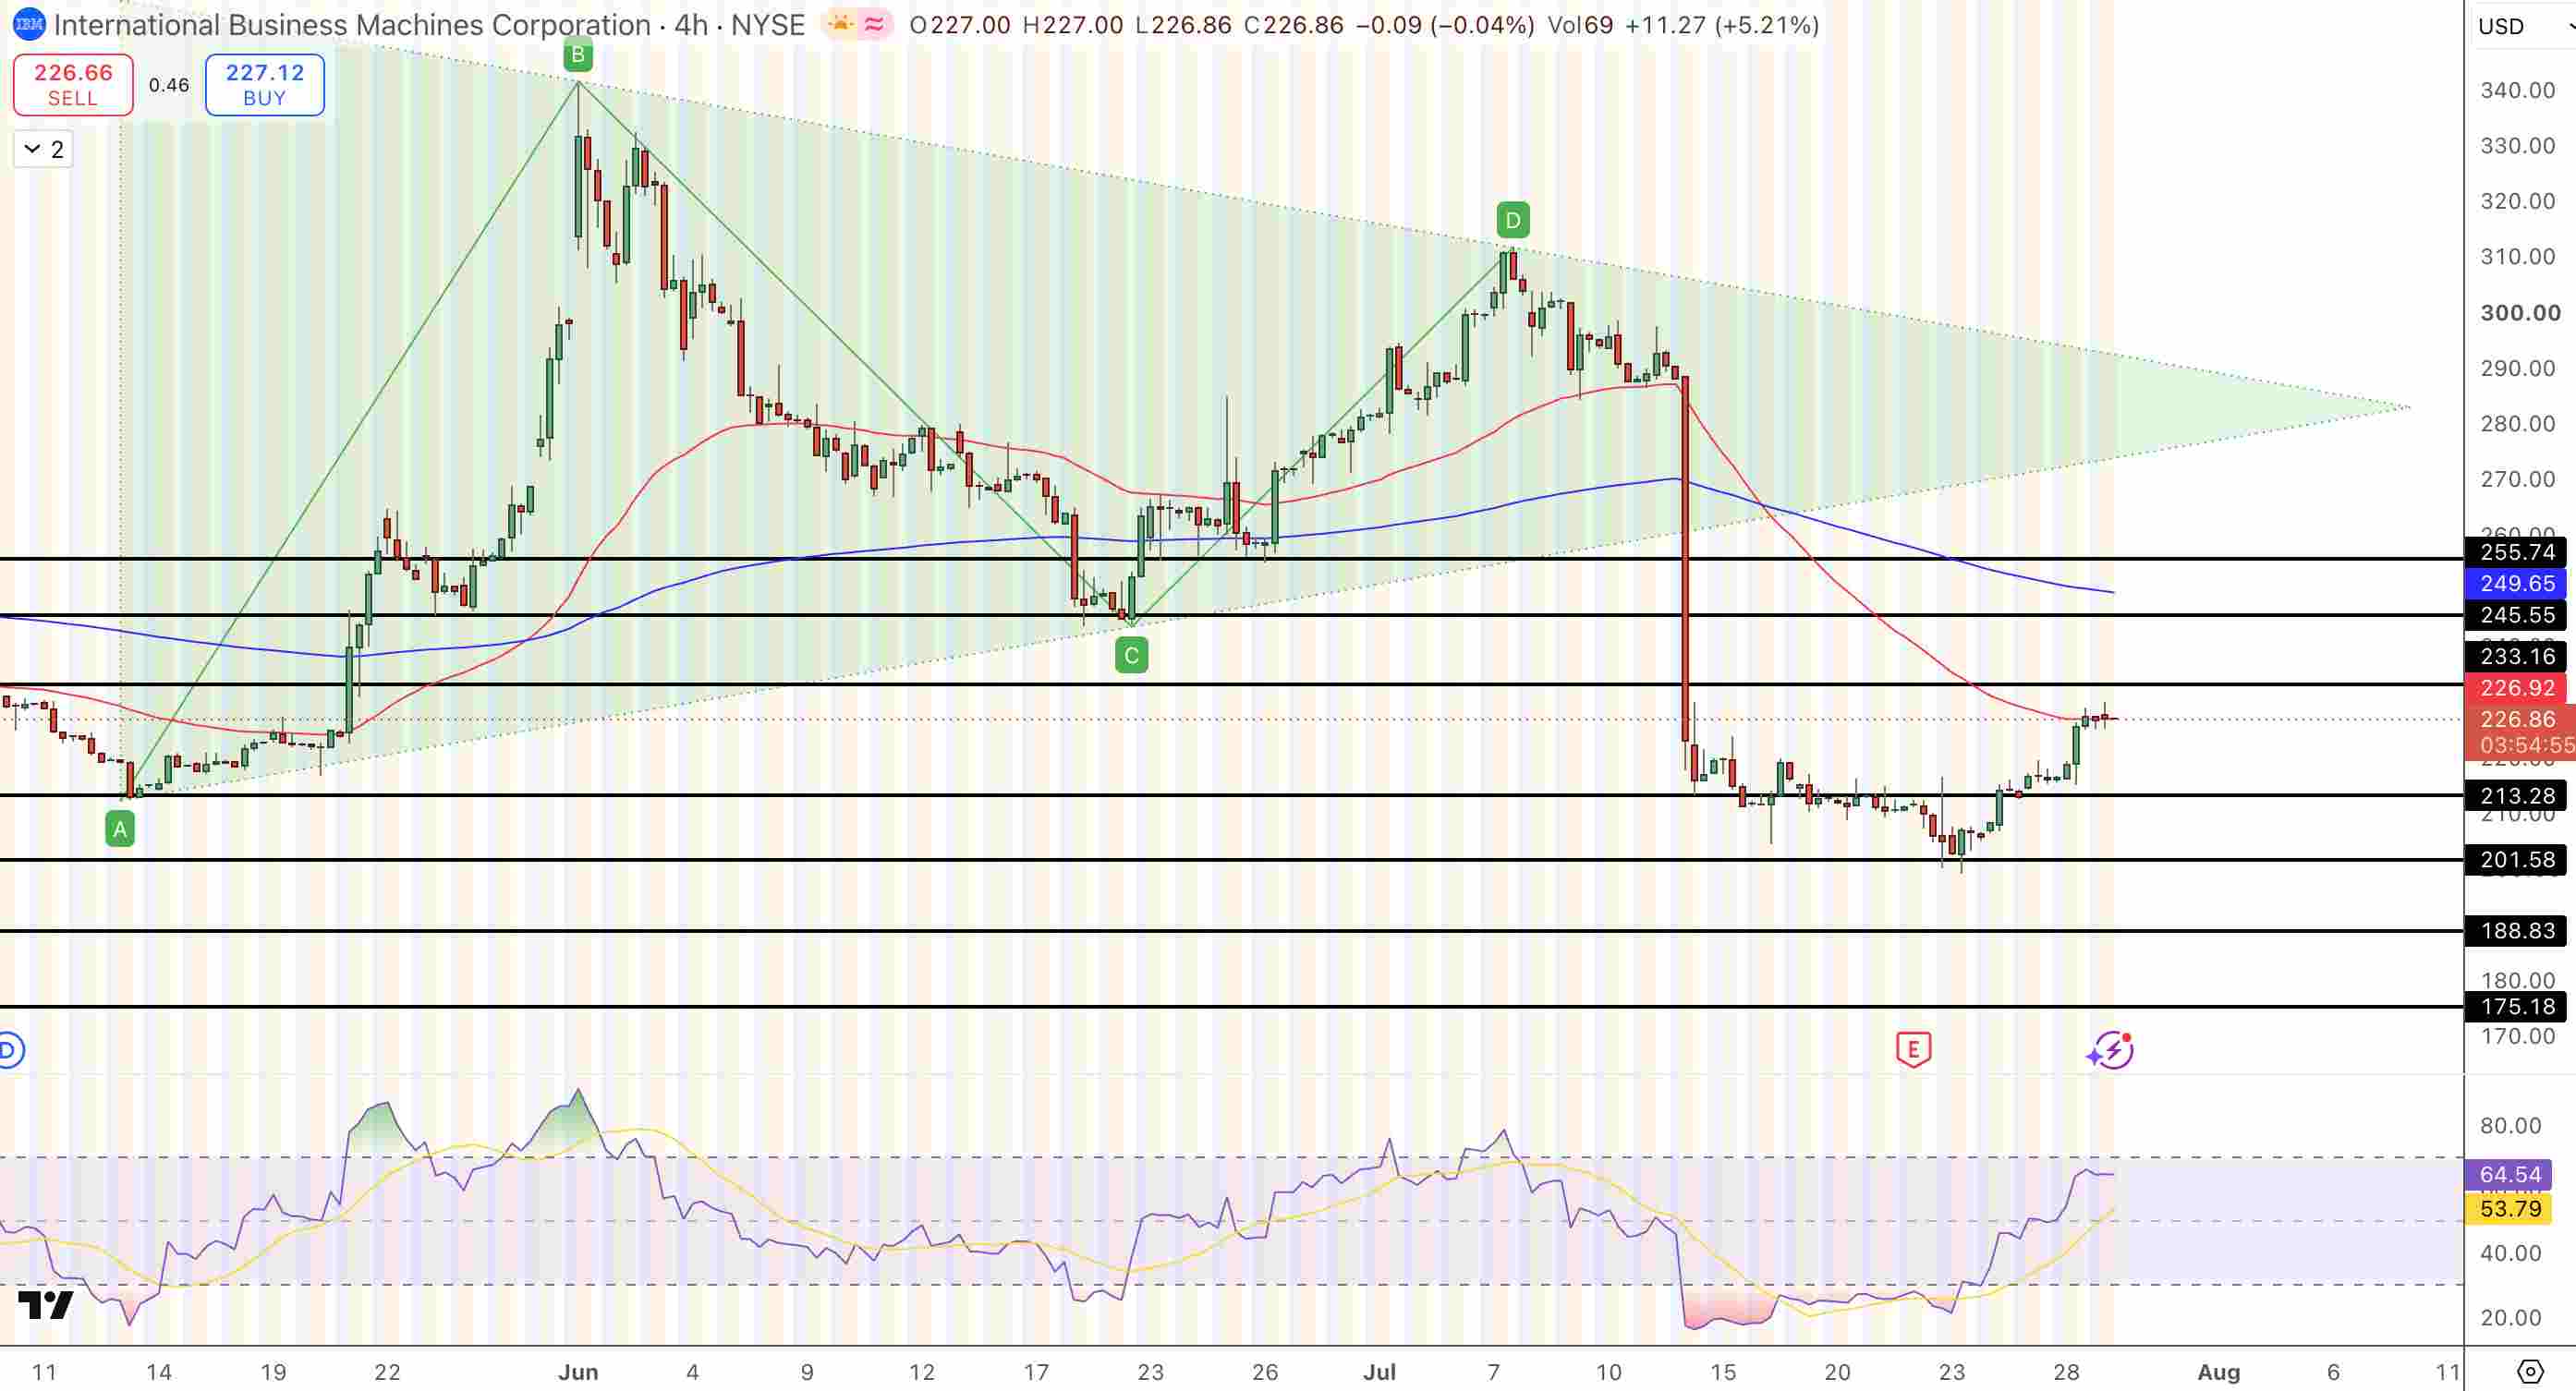
IBM Price Chart - Source: Tradingview
Key Levels
- Recovery: Up 5.62% Monday, to ~$226.90. Bounced off post earnings low of $201.60
- High to low: $306 in July to $201.60 = -34%. Current $226.90 = -26% from peak
- Q2 confirmed: Revenue $17.16B (+1% YoY). Adj EPS $2.93. Software +5%. Mainframe -42%
- Guidance: FY2026 constant currency growth 4-5%. FCF +$1B YoY. Margin +100bps
- Investigation: Securities fraud investigation ongoing. No charges filed. Open issue
- Quantum: Letter of intent signed to build US quantum chip foundry
- Resistance: $233.20 (50 EMA), $245.50, $249.70 (200 EMA), $255.70
- Support: $213.30, $201.60 (post earnings low), $188.80
Why did IBM drop 25% on July 14 and another 7% following Q2 results?
IBM fell 25.2% on July 14 following preliminary Q2 results which showed revenue of $17.2 billion, up 1% versus the $17.86 billion estimate and adj EPS of $2.93 vs a consensus of $3.01. It marked IBM’s largest ever single-day decline going back to 1968, even worse than Black Monday in 1987. CEO Arvind Krishna admitted that IBM had “missed” as enterprise customers shifted spending to AI hardware and held back IBM software and consulting spending. Following the July 22 full Q2 results which confirmed the preliminary numbers, the stock fell another 2.25% to $205.77 before rebounding 2.69% in after hours trading following management’s full commentary and guidance update of 4-5% for the full year.
What is IBM’s quantum chip foundry announcement?
During Q2, IBM signed a letter of intent to build a US quantum chip foundry. This adds manufacturing capability to IBM’s quantum computing research program. IBM has spent over $10 billion on quantum related programs over many years. A US quantum chip foundry would make IBM both a quantum research leader and a manufacturer of the specialized chips needed for quantum computers. This matters because quantum computing is expected to be necessary for problem sets where classical computing is limited, including drug discovery, materials science, and optimization. The letter of intent is a commitment to move forward with plans, not a funded construction contract, so near-term revenue impact is negligible.
Bottom line
IBM rose 5.62% Monday and is recovering from $201.60 to $226.90 as the stock tries to base after the worst decline in its history. Q2 confirmed software growth of 5% with generative AI accounting for 50% of consulting signings. Mainframe was down 42% in the trough of a product cycle. Full year guidance of 4-5% constant currency growth establishes a floor. Immediate resistance to watch is $233.20 50 EMA. RSI is 65, approaching overbought post recovery. The investigation remains an overhang until formally concluded. $306 in July was 35% above today, not reachable without resolution of the investigation and consistent execution.
Recommended Articles








Comments (0)
Click the $ button, enter the symbol, and select to link a stock, ETF, or other ticker.