


Wayfair Stock Forecast: Can Customer Growth Sustain the Recovery Ahead of Q2 Earnings?



AI Podcast


Wayfair enters its August 4 earnings report with improving operating efficiency and renewed active customer growth. Q1 revenue rose 7.4% to $2.93 billion, aided by disciplined marketing spend. Despite this momentum, the company faces persistent challenges, including negative free cash flow, high interest expenses, and potential gross margin pressure from customer retention investments. While technical indicators suggest a bullish trend above $91.87, long-term success depends on translating market share gains into sustainable profitability and debt reduction. Investors will closely monitor margin guidance and cash flow generation to validate the company’s turnaround strategy against broader housing market headwinds.
TradingKey - Wayfair (NYSE: W) enters July 28 with better customer trends and operating efficiency. Yet, it faces weak housing activity, negative free cash flow, and significant interest expense. Shares are near $94.53, giving the home-furnishings e-commerce business an approximate market cap of $12.4 billion heading into second-quarter earnings on Aug. 4.
The stock has recently been rising in anticipation of Wayfair gaining market share in a still struggling industry. However, can Wayfair continue growing revenue while maintaining its margin gains after years of restructuring?
Active Customer Growth Returns
Wayfair saw its biggest uptick in active customers since the post-pandemic slump. Net revenues grew 7.4% year over year to $2.93 billion, due to increases in U.S. and international revenues. U.S. revenues grew 7.5% to $2.61 billion, while international revenues were up 6% to $319 million or 1.7% in constant currency terms. Number of active customers grew 1.4% year over year to 21.4 million at the end of March. Wayfair has seen its customer count decline in recent years as spending on furniture and other discretionary home goods has waned.
But it wasn’t just customer counts that improved, with revenue per active customer over the last 12 months growing 5.2% to $591. The number of orders per customer also grew, rising to 1.88 from 1.85. Wayfair fulfilled 9.4 million orders, up 3.3% from the prior year. Order value averaged $312, up from $301. Almost 80% of all orders were repeat orders, showing the importance of customer loyalty and Wayfair’s loyalty program. Delivered orders from mobile devices made up 64.7% of total orders, compared with 63.4% previously, underscoring the importance of Wayfair’s mobile-first strategy.
Operating Efficiency Strengthens
Wayfair reported an even greater percentage improvement in operating performance than revenue during the quarter. Adjusted EBITDA increased to $151 million from $106 million a year earlier. Adjusted diluted earnings per share rose to $0.26 versus $0.10 a year ago. Reported operating loss improved significantly to $11 million versus $122 million a year ago. Still, Wayfair reported a net loss of $105 million as it deals with interest expense, restructuring costs, and a $43 million loss on the repurchase of convertible debt.
Advertising expense decreased 4.4% to $329 million despite higher sales. Advertising represented 11.2% of revenue compared with 12.6% a year ago, demonstrating better advertising returns. Selling, operations, technology and general expenses also decreased slightly to $424 million. Excluding equity compensation, these costs declined 2.7% mainly due to lower compensation expense following previous layoffs.
The combination of better revenue and lower operating costs is one of the most promising elements of Wayfair’s recovery. It implies the potential for Wayfair to gain market share without having to spend heavily as it did in the past.
Gross Margin Faces Pressure
Gross profit increased to $880 million from $837 million; however, gross margin fell to approximately 30% from 30.7%. Cost of goods sold increased by 8.3%, slightly faster than revenue, primarily due to investments in customer experience initiatives and a prior-year quarter that included a one-time duty adjustment.
The company stated that gross margin could come under greater pressure in the future as additional investments are made in customer retention programs, price cuts and other initiatives. That’s one critical tradeoff to monitor. While cheaper prices, shipping incentives and loyalty perks might boost repeat orders, they could undermine profitability if new customers and subsequent reorders fail to compensate for the costs.
Debt and Cash Flow Remain Key Risks
Wayfair finished March with about $1.06 billion in cash and short-term investments, down from $1.54 billion at the end of 2025. It also had access to a $500 million revolving credit facility with no borrowings drawn, though it had letters of credit that reduced the available balance. Wayfair has continued paying off short-term debt, including $250 million of its 2027 notes and part of its 2028 notes, but it incurred additional costs as well.
Net interest expense rose to $39 million from $23 million after 2025 secured-debt offerings. Operating cash outflow improved to $52 million from $96 million, and free cash flow was negative at $106 million. The first quarter is typically weaker due to seasonality in working capital, but positive cash flow is necessary if Wayfair hopes to pay down debt without depending too much on refinancing.
August Earnings Will Test the Recovery
Wayfair (W) is scheduled to report Q2 results ahead of the US opening bell on August 4, with a conference call at 8am ET. The report will reveal whether active customers continued expanding, whether average order values stayed firm and what cost the company incurred to support its market-share expansion. Gross margin guidance, free cash flow generation, marketing efficiency and debt paydown will also come under scrutiny.
Wayfair’s underlying fundamentals have been improving. Revenue is expanding, active customer growth has resumed and operating expenses are becoming more productive. But furniture sales remain highly sensitive to housing conditions, shoppers are still wary of spending, and interest costs are dragging on profitability. The earnings release must prove that Wayfair can maintain its operational momentum while spending to grow its loyalty programme, stores and customer satisfaction.
Wayfair Technical Analysis: Breakout Supports Bullish Reversal
Wayfair has produced a meaningful breakout as the stock surged through the descending trendline that had capped the rally since late June. A strong bullish candlestick closed above $91.87, confirming bullish follow-through after multiple higher lows along the ascending support trendline. The breakout occurred after a bounce off the 200-period EMA at $83.26.
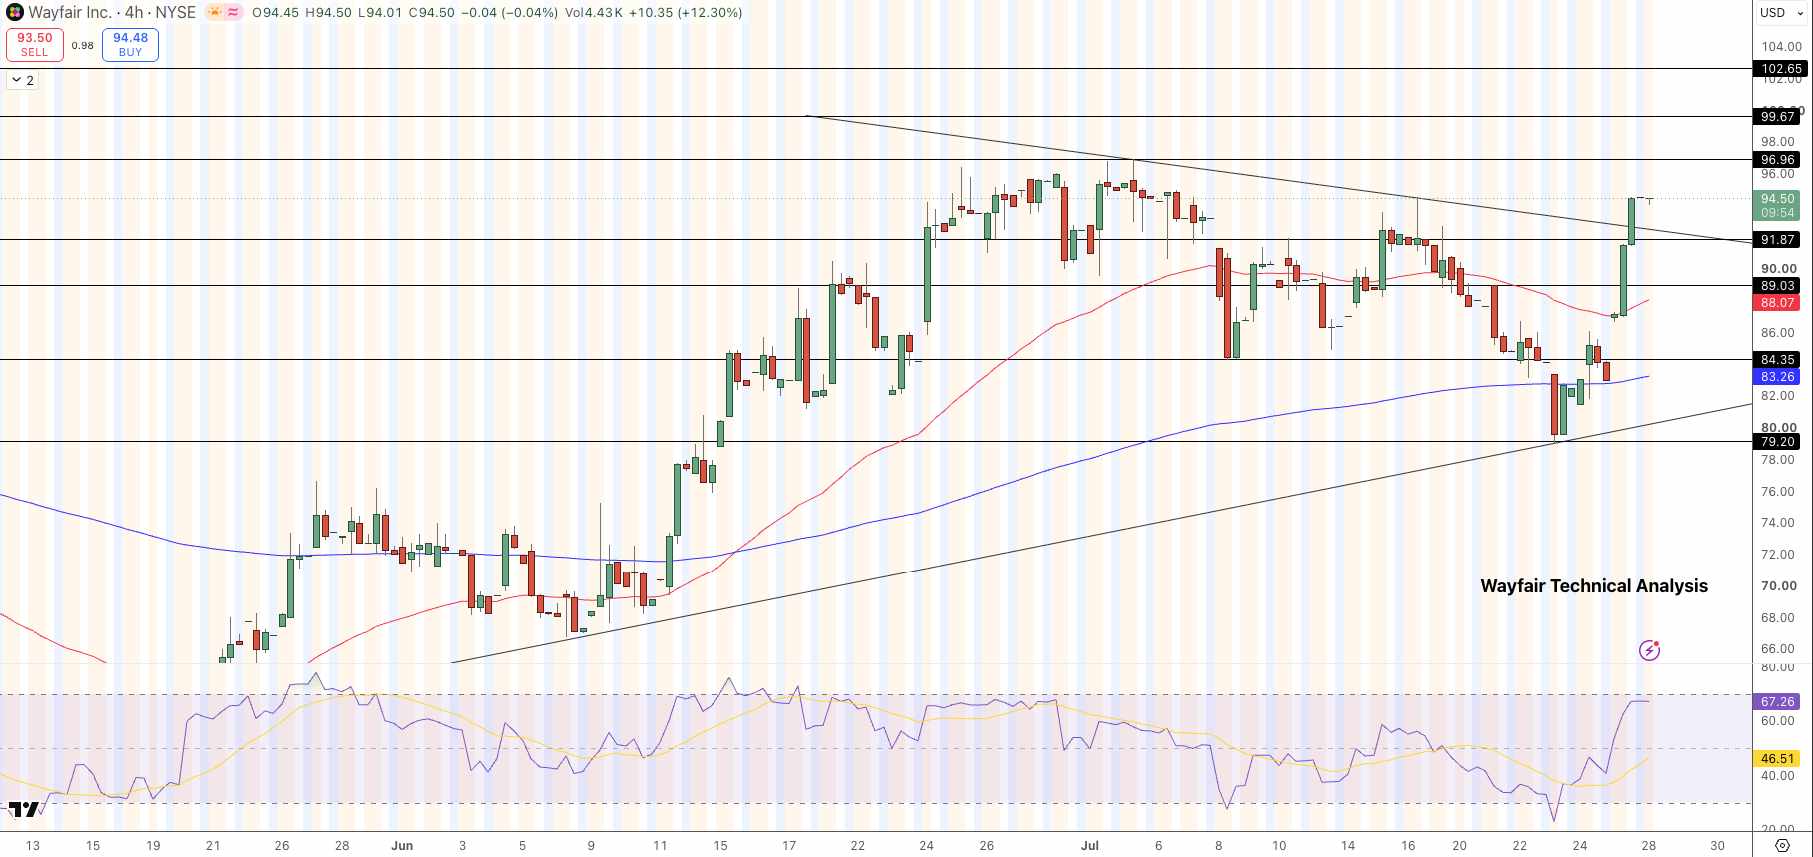
Wayfair Stock Price Chart - Source: Tradingview
The 50-period EMA at $88.07 is pointing higher, providing dynamic support. The 200-period EMA continues to slope higher, supporting a constructive medium-term outlook. RSI is at approximately 67, indicating strong bullish momentum without reaching overbought extremes. A pullback following the recent strength would be constructive but momentum remains intact.
If the stock holds above $91.87, upside targets include $96.96, $99.67 and $102.65. Downside risk begins at $91.87, then $89.03 and the 50-period EMA at $88.07. A loss of $88.07 may bring the 200-period EMA at $83.26 into play.
Resistance: $96.96, $99.67, $102.65
Support: $91.87, $89.03, $88.07, $83.26
Bottom Line
Wayfair is set to report Q2 earnings with the best operating momentum it has enjoyed in years. Customer growth has restarted, AOV is improving and management is delivering better returns from ad spend and operating expenses. The challenge is to demonstrate these gains can persist as the company spends to bolster its loyalty programme, stores and customer experience.
Wayfair’s turnaround will hinge on its ability to translate top-line growth into positive free cash flow, defend gross margins and delever. The chart structure remains bullish above $91.87, with momentum aligned for a run towards the $96.96-$102.65 resistance zone.
Recommended Articles











Comments (0)
Click the $ button, enter the symbol, and select to link a stock, ETF, or other ticker.