


Intuitive Surgical (ISRG) Down 30% This Year; Can Tonight’s Q2 Earnings Reverse the Bearish Channel?



AI Podcast


Intuitive Surgical (ISRG) trades in a downtrend at $389, down 30% year-to-date due to valuation compression and tariff concerns despite strong underlying fundamentals. For Q2 2026, analysts anticipate EPS of $2.48–$2.50 and revenue of $2.81–$2.82 billion. Key metrics to monitor include procedure volume growth above 15%, da Vinci 5 adoption rates, and management’s full-year guidance. A daily close above $397.24, supported by strong results, could break the current downtrend, targeting $414.71. Conversely, a miss or negative tariff-related margin commentary risks testing support at $378.74 and $369.56. Major institutions maintain bullish price targets significantly above current levels.

TradingKey - On Wednesday, July 16, Intuitive Surgical (NASDAQ: ISRG) is priced at $389. The stock is currently contained in a downtrending channel, on the four-hour chart. With the RSI at 37 and the 50 and 200 EMAs above price, ISRG is poised to make a move.
The company reported second quarter 2026 earnings today after market close. According to estimates, analysts are expecting ISRG to post an EPS of $2.48 to $2.50, a 14% rise from EPS of $2.19 in the second quarter of 2025. Analysts are expecting the company to report a top line of $2.81 to $2.82 billion. This would be a 15% increase over top line of $2.44 billion in second quarter 2025. ISRG has beaten earnings for the past four quarters.
Even after these positive results, ISRG is down 30% year-to-date, indicating the reason is due to valuation compression and concerns about tariffs, not because of any fundamental negative changes to the business. Tonight, a positive earnings beat could send ISRG over $397.24. Additionally, if the company provides any positive guidance regarding procedure volume in its call, ISRG could break its downtrend.
Down 30% Despite Four Consecutive Beats; What the Market Is Actually Pricing
One of the largest YTD declines among large-cap health tech peers in 2026 belongs to Intuitive Surgical. That decline has nothing to do with the fundamentals: in Q1 2026, procedure volume grew 17% year-on-year, da Vinci placements expanded from 367 to 431, and da Vinci 5 placements rose from 147 in the prior year to 232. That quarter also featured a double-digit EPS beat and a revenue beat. What investors are pricing in is a combination of valuation and tariff dynamics.
For instance, at the beginning of 2026, ISRG was trading at more than 60 times forward earnings and high-multiple health tech companies like it came off as rate expectations steadied; that was independent of results. The current forward P/E of 36.68 times still remains well above the 25.4 times sector multiple that defines the medical equipment industry; hence, the valuation multiple compression is not even done in absolute terms.
Another driver is the uncertainty surrounding tariffs. Intuitive builds its da Vinci surgical systems in Sunnyvale, CA but sources parts from around the world. That exposed it to tariff uncertainty in 2026. Multiple sell-side analysts have cited that as a reason for trimming price targets. Bank of America slashed its price target from $650 to $520 in May, Barclays trimmed from $712 to $651 in April, and Evercore dropped its price target from $480 to $430 in July. On July 9, BMO gave the stock an initial Outperform rating with a $518 price target and said the pullback is an overreaction.
The average analyst price target remains well above the current $389 stock price. Tonight’s Q2 conference call will serve as the first opportunity to hear management’s comments about how much in tariffs have impacted margins in Q2, and whether the premium in da Vinci 5 pricing is covering those tariff costs.
What Q2 Needs to Show; Three Variables That Move the Chart
Perhaps the most important single figure to focus on during tonight’s earnings call is growth in procedure volume. ISRG reported Q1 2026 procedure volume growth of 17%, the third straight quarter at or above 15%. A 15% plus growth rate in Q2 would keep the growth-in-demand narrative intact even if system placements or ASPs decline. As hospitals purchase da Vinci systems based on whether the procedure volume generated justifies the cost of the system, procedure volume serves as a leading indicator of the system placements that will follow. The consensus for Q2 2026 procedure volume growth is around 16%-18%, in line with growth recorded in Q1.
The next variable that could move the stock is adoption of da Vinci 5, Intuitive’s next-generation surgical system that includes a new Force Feedback capability that gives surgeons a physical feel for the tissue pressure or resistance that they are experiencing during a surgical procedure. That’s a distinct technological advance from the prior generation of the da Vinci system and from competing systems such as Medtronic’s Hugo. Da Vinci 5 commands a higher average selling price than the da Vinci Xi model it has supplanted, and that is how procedure growth generates revenue growth beyond system placements. In Q1 2026, Intuitive installed 232 da Vinci 5 systems, an improvement from 147 units in Q1 2025. If that pace of growth in Q2 continues, the mix of higher-ASP systems bodes well for higher margins in Q2.
The third variable to focus on is full-year guidance. Intuitive provided Q2 revenue guidance of $2.73 billion to $2.78 billion during its Q1 2026 results. Analysts currently have revenue expectations for Q2 at $2.81 billion to $2.82 billion, so even in that case, the street expects a beat. Should management boost full-year guidance during the Q2 2026 results call, ISRG could breach the $397.24 resistance and move toward the next upside target.
ISRG Technical Setup: Descending Channel, RSI 37, $397 Is the Key Level Tonight
ISRG has formed a descending channel on the four-hour chart since the top in late April. On that time frame, ISRG has a 50-period EMA ($405.09) and 200-period EMA ($422.18) serving as resistance above it. The RSI is hovering at 37 and has not yet sent a signal to buyers, and $397.24 is the price where the prior support turned into resistance.
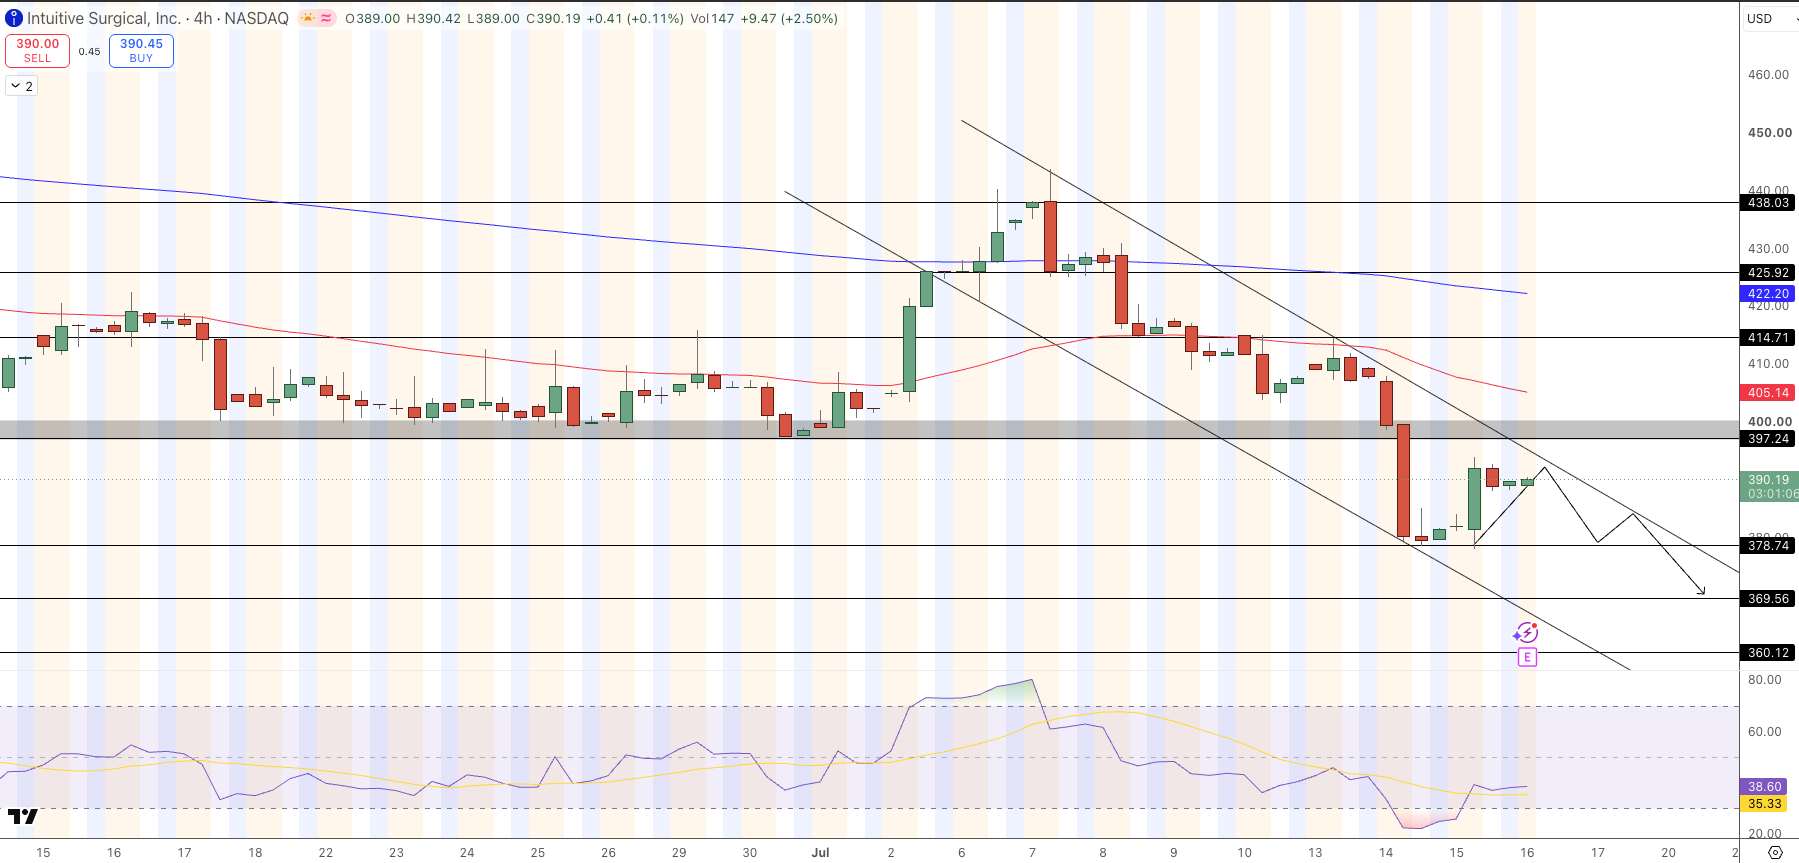
Intuitive Surgical (ISRG) Price Chart - Source: Tradingview
A close above $397.24 on a daily timeframe should send ISRG to the next resistance level around $414.71. A breach below $378.74 should lead to the next downside target, $369.56.
- Earnings release: After market close today, July 16. Consensus earnings per share at $2.48 to $2.50 (+14% Y-o-Y).
- Revenue consensus at $2.81 to $2.82 billion vs Q2 2025 at $2.44 billion (+15% to 16% Y-o-Y).
- Watchlist: Procedure growth >15%, number of da Vinci 5 systems installed, full-year outlook boosted.
- Bull case: A daily close above $397.24 would be the top resistance level and a breakout should move the stock to $414.71.
- Bear case: A drop below $378.74 should send the stock to $369.56.
- Wall Street: BMO Outperform $518 (Jul 9). Bank of America $520. Barclays $651.
What Happens to ISRG Stock If It Beats Tonight?
An EPS beat and top-line beat along with procedure volume guidance that beats estimates and a raise to full-year guidance would be the combination most likely to break ISRG from its long-term downtrend. The first barrier to climb over is $397.24, an area where support has turned into resistance. A daily close above $397.24 would test the next level at $414.71 and start to move ISRG back toward its 50-day moving average.
On the other hand, a bottom-line miss or cautious guidance with a call for tariffs to drive higher costs should see the stock fall back through $378.74 and head toward $369.56. RSI is around 37 and not yet oversold, so there’s more downside before technical indicators will force a rebound without other reasons to jump back in.
Bottom Line
Intuitive Surgical is scheduled to announce its Q2 2026 results after the market closes today against consensus estimates of $2.48 to $2.50 per share and $2.81 to $2.82 billion in revenue. Despite four consecutive quarters of earnings beats, the stock has lost 30% since the start of 2026, with investors already pricing in valuation compression and tariff risks. ISRG now trades in a downtrend at $389, and RSI (14) is at 37.13, so although RSI is beginning to ease, it still isn’t oversold.
The key number to watch tonight is $397.24; a daily close above $397.24 with a Q2 beat and raised FY 2026 guidance would signal the end of this multi-month downtrend and target the next level at $414.71. On the flip side, a miss and guidance that warns of tariff-related cost pressures could trigger a re-test of $378.74 and then test $369.56. BMO, BofA, and Barclays have Buy/Outperform/MOAT equivalent ratings and price targets from $518 to $651.
Recommended Articles










Comments (0)
Click the $ button, enter the symbol, and select to link a stock, ETF, or other ticker.