


BlackRock (BLK) Smashes Q2 2026 With $15.3 Trillion AUM and a 10.84% EPS Beat; Is $1,154 the Next Stop?



AI Podcast


BlackRock reported strong Q2 2026 results on July 15, with adjusted EPS of $13.91, exceeding consensus estimates, and revenue of $7.084 billion, a 31% year-on-year increase. Assets under management reached $15.3 trillion, supported by record half-year net inflows of $321 billion. Enhanced margins of 45.9% reflect operational scaling and a shift toward higher-fee private market products. While the stock shows momentum toward a $1,154 record high, current overbought technical conditions (RSI 76) suggest potential short-term consolidation. Primary risks remain tied to equity market volatility, which could impact fee-sensitive AUM and future margins.

TradingKey - Following Q2 2026 earnings that trounced expectations on virtually every front, BlackRock (NYSE: BLK) is seen at roughly $1,092 after posting its fiscal Q2 2026 results on July 15. Adjusted EPS was $13.91, a 10.84% surplus above the $12.55 to $12.70 consensus estimate, plus 15.5% year-on-year from the Q2 2025 adjusted EPS of $12.05. Sales came in at $7.084 billion, coming in $316 million more than the $6.768 billion consensus projection and a 31% year-on-year increase from $5.423 billion.
Assets under management reached $15.3 trillion after $192 billion in Q2 2026 net inflows and $868 billion over the trailing twelve months. The operating margin was 45.9%, a nearly five-year high. Pre-market, the stock was up 4.83%. RSI was near 76. Next immediate resistance levels are $1,109 and $1,130, then the $1,154 record high.
What a 10.84% EPS Beat and $192 Billion of Inflows Signal From The Q2 Numbers
BlackRock’s Q2 2026 beat was pervasive, not just a single item. The $13.91 adjusted EPS to the $12.55 to $12.70 consensus translates to a 15.5% YoY Q2 2025 from an adjusted EPS of $12.05. Revenue of $7.084 billion growing 31% year-on-year from $5.423 billion is the highest quarterly sales rate BlackRock has reported for multiple years.
The most vital number is the $192 billion in Q2 2026 net inflows, which brings YTD 2026 inflows to an all-time high $321 billion. Since net inflows are the engine driving the AUM compounding process, $321 billion in just a half-year is more capital than BlackRock drew in in several full-year periods of time, which makes the multi-year long-term story that much easier to sell.
The 45.9% operating margin is also the highest since before the 2022 rate-shock selloff compressed asset manager margins. Margins recovered with two major drivers, increasing base fees due to larger AUM and more efficient operations as BlackRock scaled its Aladdin technology stack and iShares ETF platform with little or no additional expenses.
BlackRock disclosed it grew its base fee 10% organically over the trailing 12-month period, and its AUM mix has also changed, with alternative investments, private markets, and multi-asset allocations now a larger slice of the $15.3 trillion total, versus five years ago when low-fee passive index mandates made up most of the AUM total. The higher-fee mix and increased AUM is the math behind the margin record.
How Did BlackRock Get $868 Billion In Net Inflows In The Last 12 Months?
The trailing 12-month, $868 billion net inflow number is comprised of three things. Number one, iShares ETFs are still gobbling up the bulk of the global ETF inflows with investors seeking BlackRock-managed equity and bond exposure at scale. The S&P 500 gained 21% YoY through the quarter to help auto-inflate BlackRock’s fee revenue while also adding more cash to the mix.
Second, institutional clients were pouring more money into private markets and specifically, BlackRock’s infrastructure equity, private credit, and real assets funds. Third, the retail wealth business was contributing with the Aladdin Wealth platform and separate BlackRock-managed accounts helping advisers aggregate client accounts.
The biggest danger for future inflows is an equity market reversal. BlackRock derives a large chunk of its fee income from AUM, and AUM prices rise and fall with the stock market. Another 20% drop in equities would see a $3 trillion AUM drawdown and fee reduction, which will push BlackRock back under 40% margins.
This risk exposure explains why the stock trades at 23 to 24X earnings forward versus the 30-plus X price of other stocks, even as it delivers double-digit annual growth. Asset managers are still considered a cyclical play. At $1,092, with the $1,154 record, that leaves the shares 5.7% shy of the high after a quarter removed nearly every other reason the stock would stay in the bear zone.
BLK Technicals: Stock Breaks Out At $1,087, RSI 76, Eyes $1,109 And $1,154
At $1,092, BLK is off the 4H rising channel with the two EMAs well below the price. $1,087 is the first support at the breakout level. The 76 RSI level is overbought and could trigger a minor consolidation before the next move. $1,109 will be the next resistance level, leading to $1,130 before the high is tested at $1,154.
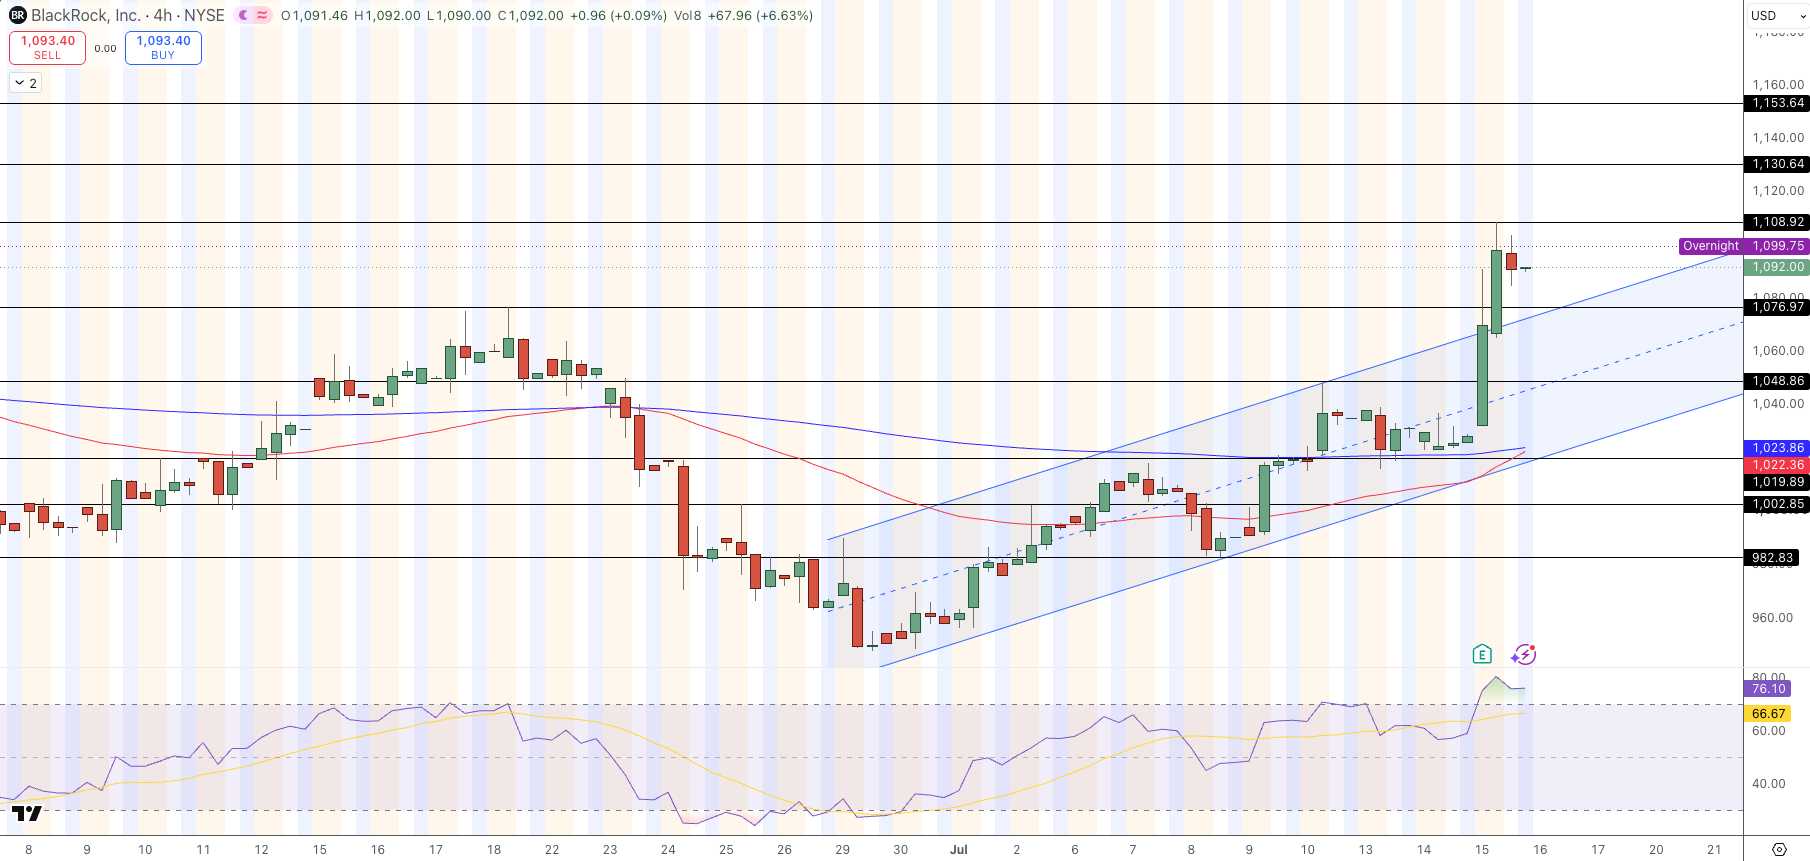
BlackRock (BLK) Price Chart - Source: Tradingview
A decline to $1,087 within a broader uptrend is a retracement rather than the trend reversal, assuming that level doesn’t close below it.
Key Q2 Statistics:
- Q2 EPS: $13.91 actual, $12.55-$12.70 consensus (+10.84%). +15.5% YoY from $12.05
- Q2 Revenue: $7.084B actual, $6.768B estimated (+$316M). +31% YoY from $5.423B
- AUM: $15.3 trillion. $192B Q2 net inflows, $321B YTD record. $868B trailing 12M
- Margins: 45.9% operating margin. +10% organic base fee growth
- Resistance: $1,109, then $1,130, then the $1,154 record
- Support: $1,087. Under that, 50-EMA at $1,022.
What Were BlackRock’s Q2 2026 Earnings Results?
BlackRock (BLK) announced its Q2 2026 financial results on July 15, 2026. BlackRock’s adjusted earnings per share (EPS) clocked in at $13.91 vs. consensus forecasts at $12.55/$12.70, a beat of 10.84%. That’s up from Q2 2025’s EPS of $12.05, marking 15.5% year-over-year growth. BlackRock posted revenue of $7.084 billion vs. estimates at $6.768 billion, a beat of $316 million. That also represented a 31% increase from the same quarter of last year.
AUM hit $15.3 trillion, with BlackRock adding $192 billion in net inflows in Q2 2026. The first half of 2026 saw $321 billion in net inflows, also a record. BlackRock’s operating margin came in at 45.9%, the highest in nearly five years. BLK shares traded up 4.83% premarket.
Why Is BlackRock’s AUM at $15.3 Trillion and What Does That Mean for Revenue?
BlackRock reported a net $15.3 trillion AUM in the second quarter of 2026. This was in part due to strong equity market and credit market performance. Over the last quarter, the S&P 500 was up 21% year-over-year, which mechanically boosted the market value of existing assets under management (AUM). BlackRock charges clients a base fee in the form of a percentage of AUM.
This means simply having a larger AUM is sufficient to boost revenue. This, combined with the $868 billion in net client inflows over the trailing twelve months helped contribute to the revenue growth. This 10% growth in organic base fee growth in the TTM was driven by net client asset inflows as well as asset shifting toward more fee-heavy asset categories including private markets, infrastructure, multi-asset and more.
Is $1,154 a Realistic Target for BLK After the Q2 Beat?
BlackRock’s stock price is $1,092, and the Q2 earnings beat was a clear confirmation. The average analyst price target on BlackRock is $1,255, a figure that is higher than BlackRock’s $1,154 record high. Given BlackRock’s record first half in 2026 of $321 billion in net client flows and 45.9% operating margin, the high, BlackRock’s fundamentals make the case for $1,154 even stronger than the previous high.
On a technical basis, the $1,087 support line holds on a daily closing basis, a daily close above $1,109 opens up the $1,130 level, and a daily close above $1,130 should see $1,154 as the next target. On a short-term basis, we watch for RSI at 76 to set up a brief consolidation or pullback to $1,087, which would not be concerning but constructive, rather than bearish.
Bottom Line
BlackRock (BLK) Q2 2026 earnings came in with adjusted EPS of $13.91, vs. a consensus expectation of $12.55-$12.70, and Q2 revenue of $7.084 billion, up 31% year-on-year. AUM reached $15.3 trillion following BlackRock’s record first-half 2026 net client inflows of $321 billion. BlackRock also reported record high operating margins of 45.9%, the highest reading in nearly five years. Trading at $1,092, RSI is close to 76 in overbought territory.
The $1,087 breakout support level should hold on a daily close basis, $1,109 is immediate resistance and $1,154 is the longer-term target. The median analyst price target on BLK is $1,255, a reading 15% higher than BLK’s all-time high, suggesting BLK’s earnings beat was fully priced-in to the current session as well as the near future.
Recommended Articles










Comments (0)
Click the $ button, enter the symbol, and select to link a stock, ETF, or other ticker.