

Broadcom Stock Forecast: Why Did AVGO Fall After $13.5B Earnings and What's Next?


AI Podcast
Broadcom's stock has corrected 17% from its high due to multiple compression, not fundamental weakness. Q2 FY2026 revenue reached $13.5 billion, driven by strong AI and Data Center growth. Despite positive fundamentals, including an improved backlog visibility and robust VMware software revenue, the stock trades at $413.63. The RSI at 29-35 at the $405.42 Fibonacci support level indicates oversold conditions with positive divergence, suggesting a potential capitulation bottom. A trade entry above $427.50 targets $441.15 and $452.20, with a stop loss below $405.40.
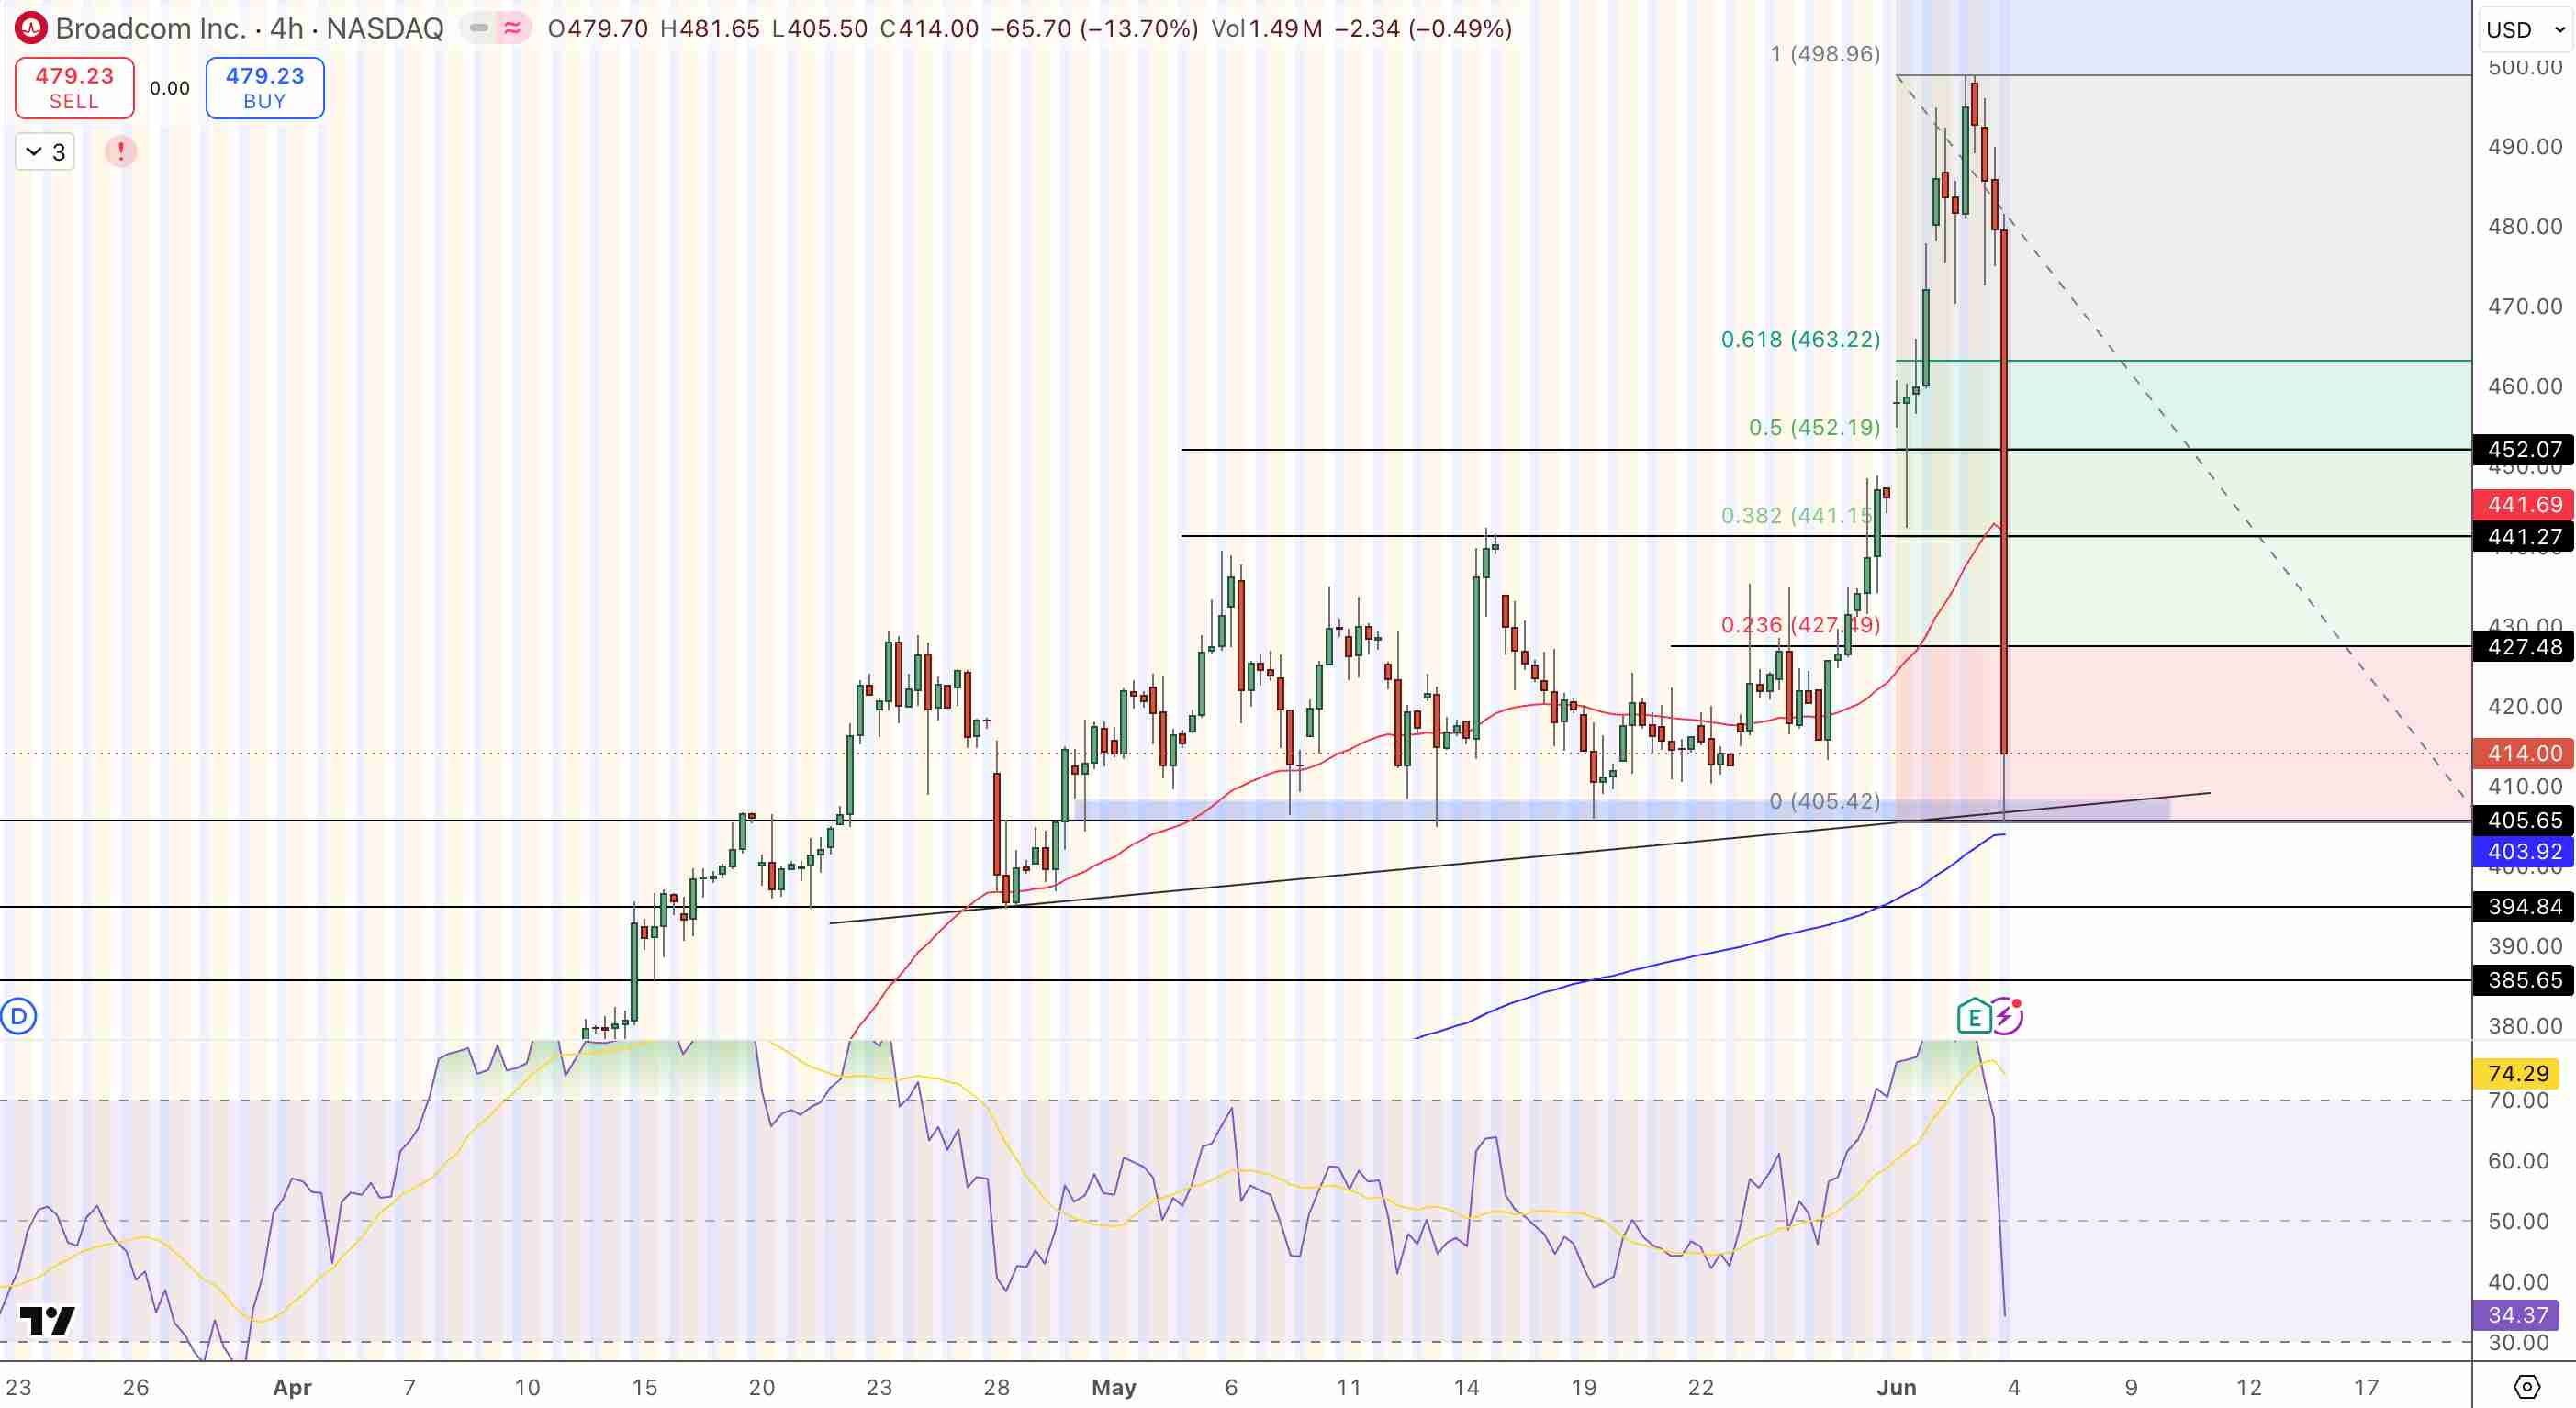
TradingKey - As of June 5, Broadcom (NASDAQ: AVGO) sits at $413.63, having completed a 17% correction from its high of $498.96. On the 1H timeframe, the price has tested the critical 0 Fibonacci level at $405.42 while the RSI has dropped to a range of 29 to 35. This is deeply oversold, representing a lower reading than the 34 noted in the June 4 analysis, and is currently forming a positive divergence on price lows. Notably, this severe drop occurred despite zero negative fundamentals: Broadcom announced Q2 FY2026 revenue of roughly $13.5 billion, posting strong double-digit growth, with AI and Data Center as the leading segments, and management pointing to faster design wins and increased backlog visibility. Put simply, this is a macro and valuation multiple-driven correction. The real question is whether the RSI hitting 29 at the 0 Fib support signals the capitulation bottom.
What Broadcom’s Q2 FY2026 Results Confirm About the Business
Q2 FY2026 generated about $13.5 billion in revenue, a remarkable feat that represents strong double-digit YoY growth for a $400B+ market cap company. Very few semiconductor firms can do that at that scale. The star performer was the AI and Data Center segment. It’s getting more and more demand for Tomahawk and Jericho Ethernet switches from hyperscalers that are constructing large scale GPU training clusters; optical DSPs to satisfy the massive interconnect bandwidth that such clusters require; and custom ASIC programs to create chips for specific hyperscaler workloads.
Management specifically noted that their visibility into the backlog has improved, and they are getting large commitments from the major cloud players. Just like it is the case with SanDisk and Marvell, the contracted revenue stream is what is allowing Broadcom to command a premium multiple for the custom ASIC business.
VMware is another fundamental component that differentiates Broadcom from a semiconductor-only stock. It’s the software portion of the VMware business portfolio, virtualization, cloud management, networking software, that produces high-margin, recurring, subscription-based revenue that isn’t related to semiconductor cycles in any way. VMware subscriptions continue to get renewed even when NAND prices drop or GPU demand slows.
It is precisely that diversification which provides Broadcom’s three-legged stool of custom silicon, merchant network chips, and software with a higher earnings and cash flow baseline than a pure semiconductor stock would. The fall from $499 to $413 is a result of multiple compression of overvalued tech stocks, not any weakness in the semiconductor or software businesses.
AVGO Technical Setup — RSI 29–35 at 0 Fib $405, Bounce Targets $441 and $452
On the 1H chart, Broadcom is trading at $413.63 with the RSI ranging between 29 and 35 and showing positive divergence off the 0 Fibonacci level at $405.42. The 0.236 Fib at $427.49 is the initial hurdle for the bounce to clear. The primary objectives are the 0.382 at $441.15 and the 0.5 at $452.20. The 0.618 at $463.22 represents the full recovery level. Every MA is above as a resistance. Any decisive close below $405.40 means this rebound thesis is blown and indicates more downside to the next support area.
TRADE SET UP
- Entry: Buy above $427.50 on reclaiming 0.236 Fib
- Target 1: $441.15 at 0.382 Fib resistance
- Target 2: $452.20 at 0.5 Fib, main target for recovery
- Target 3: $463.22 at 0.618 Fib, full recovery stop
- Stop Loss: Close below $405.40, 0 Fib resistance gives way
Q2 FY2026 Earnings Breakdown
Broadcom posted revenue of $13.5 billion for Q2 FY2026, registering double-digit growth on a year-over-year basis. The company’s AI and Data Centre business unit proved to be the top performer, fueled by the launch of the Tomahawk and Jericho Ethernet switches as well as the optical DSPs and custom ASICs utilized in the AI training and inferencing workloads of hyperscalers.
Management referenced the acceleration in design wins and improving backlog visibility with a number of leading public cloud service providers. Furthermore, Broadcom reported robust gross margins together with strong cash from operations, which underpin R&D spend and capital allocations to shareholders.
Why is Broadcom Stock Down 17% Even with Good Results?
Broadcom’s pullback from $498.96 to $413 was mainly in line with the market selling off on CPI data due to multiple compression rather than any fundamental change. CPI data for April 2026 came in at 3.8 percent overall and 4.1 percent core, bolstering the Fed’s hawkish stance in the form of Warsh and rates staying higher for a long time. This in turn sent real yields soaring and put pressure on the rich valuations associated with the AI infrastructure play.
On the back of such parabolic rally, such selling volume on a red day points towards institutional selling at the top. Broadcom’s custom ASIC development pipeline, Ethernet switching business, and VMware’s SaaS revenue are all solid.
Can the RSI of 29-35 Be a Real Bounce Indicator for AVGO?
We have a high-probability long here, with RSI of 29-35 with bullish divergence at the 0 Fibonacci retracement ($405.42). This bullish divergence where price keeps hitting new lows while the RSI maintains higher lows is a strong sign of selling exhaustion. A spike in volume at a red candle means that a lot of supply has been sold into and the selling may have subsided for a bit. Longs over $427.50 (0.236 Fibonacci recovery) with targets of $441.15 and $452.20, with stops under $405.40. This trade breaks down only if selling at $405 gets aggressive and multiple compression takes longer time to subside. The next key support area is significantly lower then.
Bottom Line
Broadcom delivered Q2 FY2026 revenue of $13.5 billion with accelerating growth in its AI and Data Centre unit while growing its custom ASIC backlog, with the VMware software revenue stream remaining a key revenue driver, yet the stock is 17% off its high. RSI at 29 to 35 with bullish divergence at the 0 Fib support ($405.42) is the best technical set up in the correction so far.
The stop loss is at $405.40, and if it goes beyond that point, then the thesis of a long is invalid and we should be re-evaluting. The trade at $427.50 is set to hit targets at $441.15 and $452.20. The business fundamentals of Broadcom are not broken; it’s just the market that is revaluing the premium on the shares.
Recommended Articles


Comments (0)
Click the $ button, enter the symbol, and select to link a stock, ETF, or other ticker.