


US-Iran Situation Deteriorates: Ethereum Shows Bullish Structure Against the Trend, Expected to Continue Outperforming Bitcoin



AI Podcast


Despite recent crypto market weakness triggered by US-Iran geopolitical tensions and rising oil prices, Ethereum displays relative resilience compared to Bitcoin. As of July 20, the total market capitalization dipped below $2.2 trillion, yet Ethereum maintained support above $1,800. Over the past month, Ethereum’s 9% gain significantly outperformed Bitcoin’s 1% increase. Supported by favorable US CPI data on July 15, Ethereum’s technical structure remains bullish. Analysts anticipate further upside toward $2,000, as Ethereum continues to show potential to drive a broader market rebound and challenge yearly highs despite global macroeconomic volatility.

TradingKey - US-Iran conflict triggered a temporary pullback in ETH, but the bullish technical structure remains intact, with potential to continue rising and outperform Bitcoin.
On July 20, the crypto market weakened further as the Middle East situation continued to deteriorate, falling 0.8% today and dropping below $2.2 trillion. Meanwhile, Bitcoin ( BTC) fell 0.74%, while Ethereum ( ETH) showed relative resilience, falling only 0.4% and continuing to fluctuate above the $1,800 level. This divergence has drawn significant market attention, with hopes that an upward breakout by Ethereum will drive a rebound in the crypto market.
Since late June, the crypto market has gained a brief respite amid the US-Iran conflict, with the prices of Bitcoin and Ethereum continuing to rebound. However, BTC's gains have lagged behind those of ETH. Over the past month, ETH has accumulated a gain of over 9%, while BTC has only risen by about 1%. Notably, the price of ETH has already broken through a key resistance level, whereas BTC has failed to achieve this.
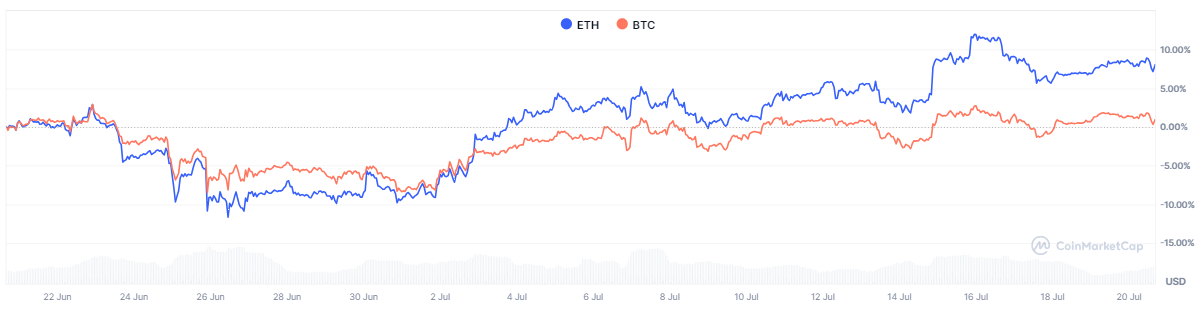 ETH and BTC Price Changes (Last 30 Days), Source: CoinMarketCap
On July 15, the US CPI data released was lower than market expectations across the board, significantly weakening the likelihood of interest rate hikes and boosting a surge in cryptocurrencies. Among them, Ethereum surged past the $1,800 level that day, which was a strong resistance level formed after the crash in early June. Meanwhile, the price of Bitcoin also rallied to around $65,000 that day, but failed to break through the resistance level of $67,000.
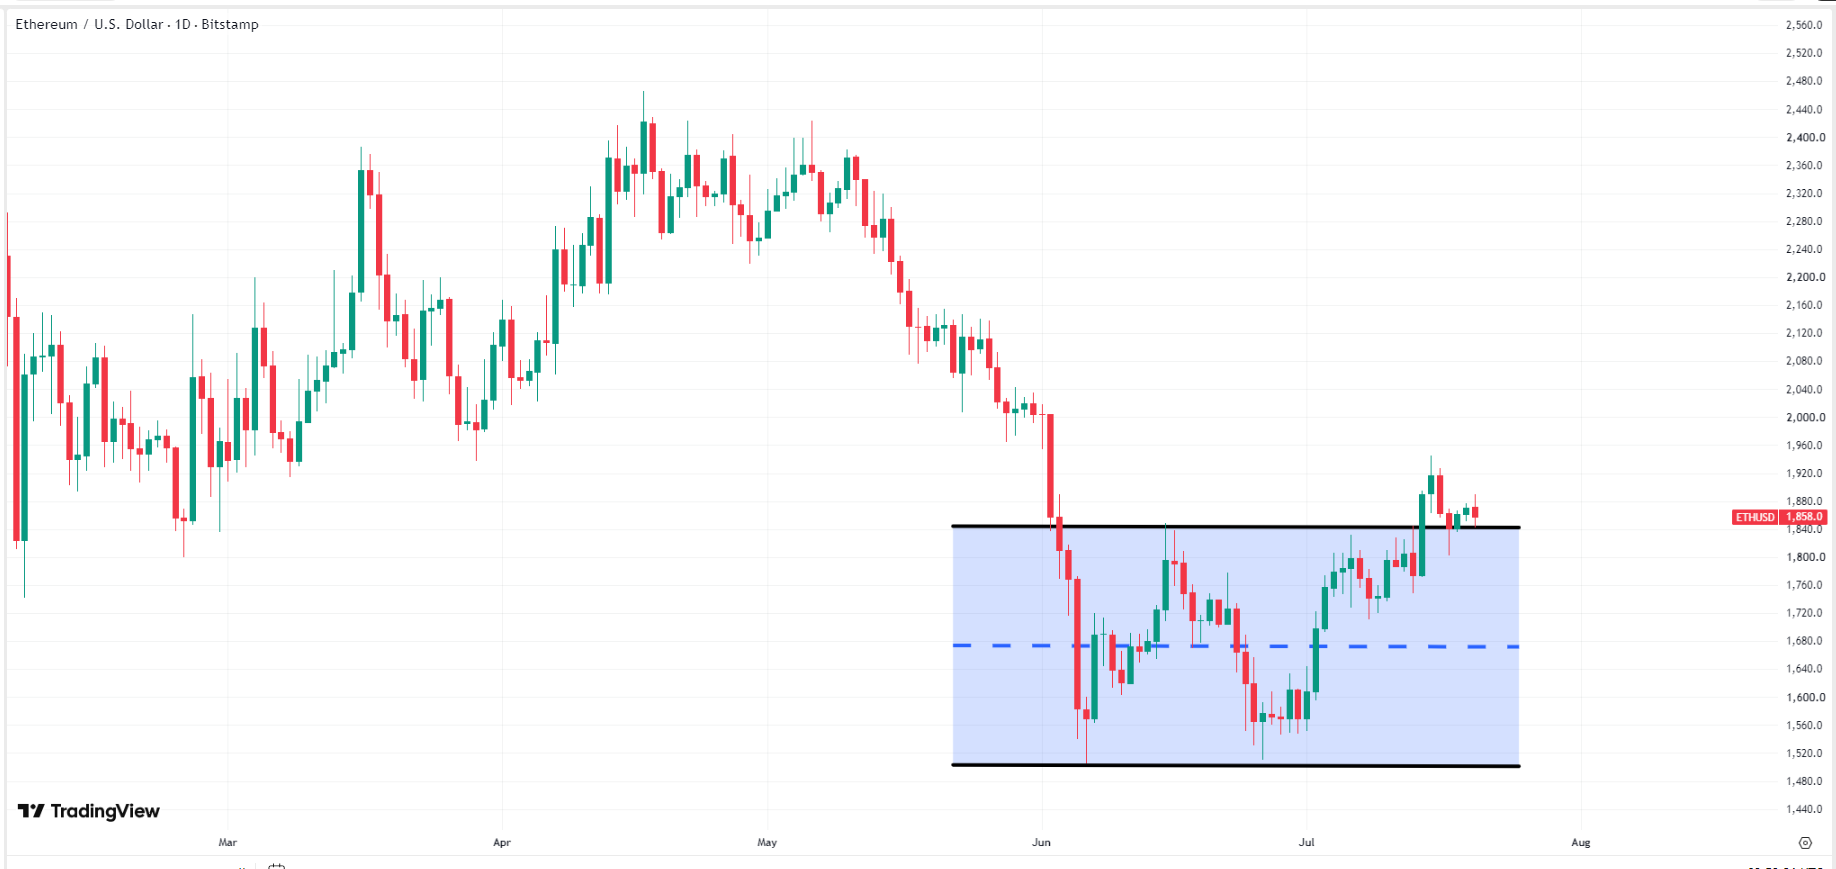 ETH Price Chart, Source: TradingView
In mid-to-late July, mutual attacks between the US and Iran escalated geopolitical conflicts again, triggering a surge in oil prices. Brent crude returned to $90 per barrel, igniting risk-off sentiment in global financial markets and putting downward pressure on crypto assets. However, the price of Ethereum did not experience a major correction, falling only about $100 (a decline of approximately 5%) and remaining above $1,800. Its technical rebound structure remains intact, and it is still expected to rebound further and break through the $2,000 mark, which is a major obstacle to challenging this year's high of $2,500.
This content was translated using AI and reviewed for clarity. It is for informational purposes only.
Recommended Articles












Comments (0)
Click the $ button, enter the symbol, and select to link a stock, ETF, or other ticker.