


Bitcoin Price Prediction: BTC Holds $86,000 as Sustained ETF Inflows Could Push It Past $90,000



AI Podcast


Bitcoin maintains strong momentum, trading near $86,500 amid a rebound exceeding 13% from recent lows. The rally is primarily driven by continuous institutional capital inflows into US spot Bitcoin ETFs, totaling nearly $1.8 billion over three days, alongside improving macroeconomic risk appetite fueled by declining oil prices and retreating Treasury yields. Technically, Bitcoin has broken above its long-term resistance range, targeting $90,000 to $92,000. However, persistent Federal Reserve rate hike expectations and inflation concerns remain key downside risks, with crucial support identified at $81,000 to $83,000.

TradingKey - As of the Asian session on September 23, Bitcoin (BTC) price continued its recent strong performance, with the latest price trading near $86,500, up about 0.3% on the day. Bitcoin reached a high of $87,395 this Monday, setting a near eight-month high. Although profit-taking emerged thereafter, the price remained stably above $85,000. Compared to the low near $76,000 on September 17, Bitcoin's cumulative rebound has exceeded 13%.
ETF Funds See Continuous Inflows as Falling Oil Prices Improve Risk Appetite
From a fundamental perspective, the core factor driving the recent continuous rise in Bitcoin prices is the sustained inflow of capital into ETFs.
Data from Farside Investors shows that US spot Bitcoin ETFs recorded net inflows of approximately $433 million on September 18, which further reached $999 million on September 21, and continued to see an inflow of about $364 million on September 22, bringing cumulative net inflows over the three trading days to nearly $1.8 billion. The previous ETF outflows triggered by setbacks with the CLARITY Act and Federal Reserve interest rate hikes have clearly reversed, with institutional demand once again becoming a key force driving BTC past $80,000.
The macroeconomic environment has also shown some improvement recently. Renewed expectations of US-Iran negotiations, coupled with the resumption of operations on a Saudi oil pipeline, led to a noticeable drop in international oil prices. Lower oil prices helped ease market concerns that energy costs could drive US inflation higher again, while the 10-year US Treasury yield also retreated, providing overall support for risk assets. On Monday, the Nasdaq Composite Index hit a record closing high, and Bitcoin surged over 6% during the same period, indicating that the current BTC rally remains clearly driven by improving risk appetite.
However, Federal Reserve policy remains a major risk going forward. Officials such as Richmond Fed President Barkin have recently continued to emphasize inflationary pressures, and the market probability of another Fed rate hike in October remains around 50%.
Overall, continuous ETF capital inflows and falling oil prices provide upward momentum for Bitcoin, but the risk of further Fed rate hikes continues to limit valuation expansion. If ETFs maintain net inflows while US Treasury yields do not rise significantly again, the foundation remains in place for Bitcoin's current rebound to continue.
Bitcoin Price Technical Analysis
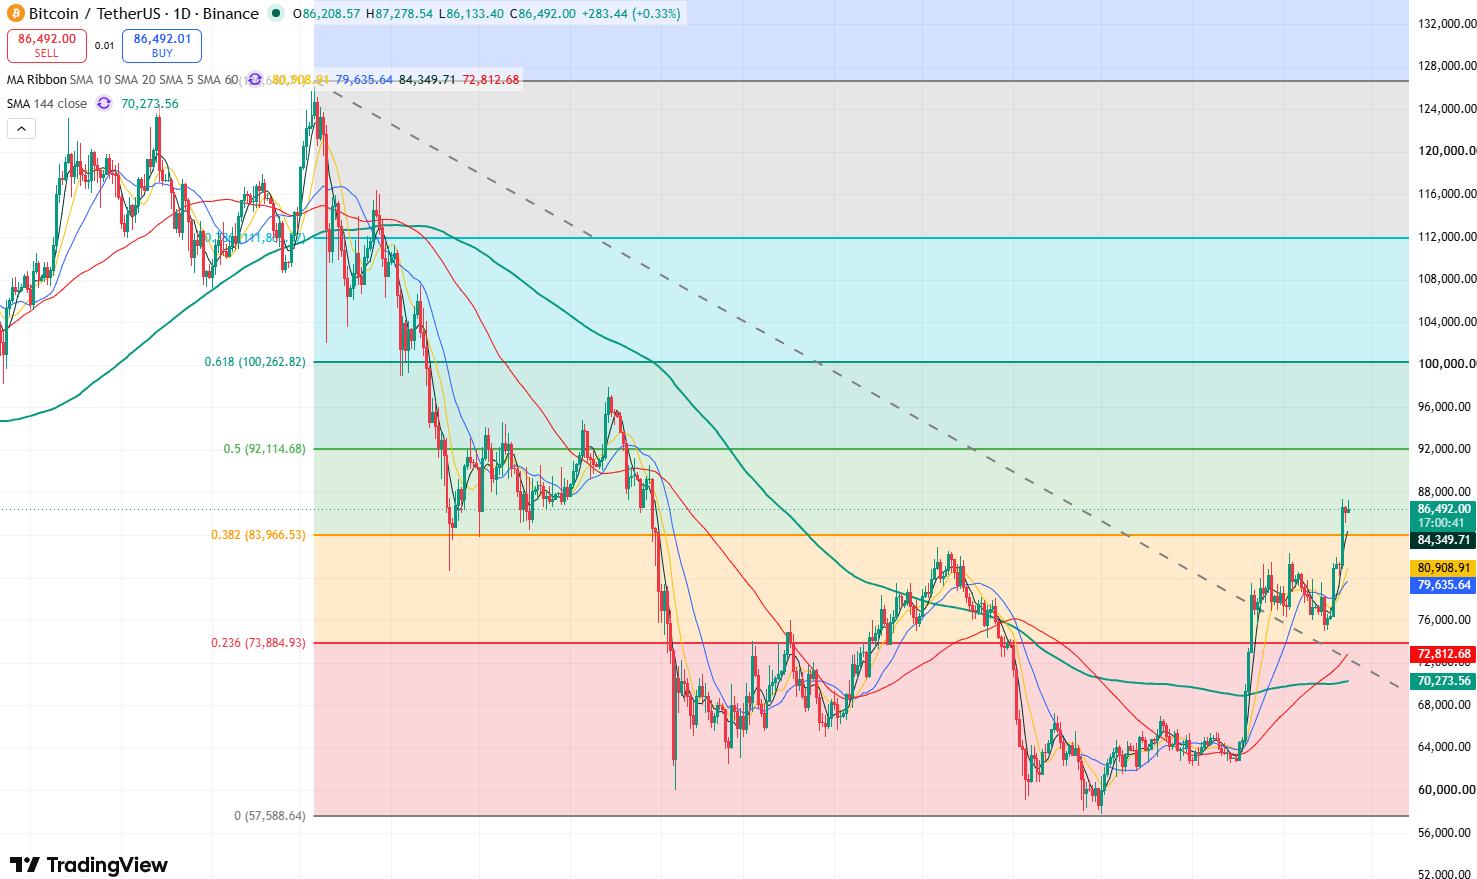
Bitcoin price daily chart, Source: TradingView
Looking at Bitcoin's daily chart, Bitcoin has effectively broken above the $80,000-$83,000 range that previously suppressed prices for a long period, and has reclaimed $85,000. The short-term upward structure has significantly improved, with market bullish momentum markedly strengthened.
Currently, as Bitcoin broke above the $83,000 resistance level, its candlestick structure broke the downtrend in place since October 2025. It may sustain its gains in the short term, with the primary target testing upward toward $90,000-$92,000. If Bitcoin breaks out and holds firmly above $92,000, it will further open up upside space toward $98,000-$100,000.
On the downside, the primary support level to watch below is $81,000-$83,000. If it falls below $81,000, Bitcoin may test the support zone near $75,000.
This content was translated using AI and reviewed for clarity. It is for informational purposes only.
Recommended Articles










Comments (0)
Click the $ button, enter the symbol, and select to link a stock, ETF, or other ticker.