

Bitcoin Price Trend Forecast: Continued ETF Outflows Limit Bitcoin Price Rebound Space, $58,000 Becomes Key Level for Bulls and Bears


AI Podcast
As of the European trading session on July 1, Bitcoin trades near $58,700, down 33% year-to-date. Persistent net outflows from US spot ETFs, exceeding $1.72 billion since June 17, signal institutional risk aversion. Fundamental pressure is exacerbated by mining costs exceeding market prices, a strengthening US dollar, and hawkish Fed rate expectations. Technically, Bitcoin has breached key medium-term support, shifting sentiment to bearish. While $58,000 serves as a critical pivot, the prevailing trend suggests limited upside, with potential downside risks toward $49,000-$50,000 should this support fail. Investors are currently favoring shorting rallies over long-term accumulation.

TradingKey - As of the European trading session on July 1, Bitcoin ( BTC) fluctuated around $58,700, hitting a new year-to-date low of $57,800 earlier in the day before recovering slightly, though it still failed to reclaim the $60,000 threshold. From a market perspective, under the influence of continuous outflows from ETF funds, the price of Bitcoin has recently trended downward, bringing its year-to-date decline to 33%.
Bitcoin Under Pressure from ETF Outflows, Rising Mining Cost Pressures, and a Stronger US Dollar
From a fundamental perspective, the core driver behind the recent downward trend in Bitcoin is the continuous outflow of capital from spot Bitcoin ETFs. According to data from Coinglass, US spot Bitcoin ETFs continued to experience significant net outflows in late June. Since June 17, Bitcoin ETFs have recorded net outflows for nine consecutive trading days, with the total outflow reaching approximately $1.72 billion; the capital outflow from Bitcoin ETFs on June 24 alone was close to $500 million. The data indicates that Bitcoin ETFs have been facing redemption pressure for several consecutive weeks. This suggests that institutional capital did not actively buy the dip after BTC fell below $60,000, but instead continued to reduce risk exposure.
At the same time, pressure on miners and corporate holders is also rising. JPMorgan estimates that the recent price of Bitcoin has fallen below the production cost of approximately $78,000, and some miners may choose to shut down their machines or pivot to AI data center operations. Previous selling actions by large holding institutions, such as MicroStrategy, have also weakened market confidence in the concept of "corporate treasuries continuously absorbing Bitcoin." While the long-term holding logic remains intact, short-term liquidity pressure is more easily amplified by the market.
In addition, the strengthening of the US dollar and US Treasury yields is another major reason why Bitcoin is under pressure. Recent US economic data has shown continued resilience, fueling market expectations that the Federal Reserve will maintain high interest rates or even tilt further hawkish. A high-interest-rate environment is generally unfavorable for highly volatile risk assets like Bitcoin, as capital tends to flow toward US dollar cash, short-term bonds, and assets with more stable yields. Against the backdrop of a strengthening dollar, it is difficult for Bitcoin to shake off pressure on its own.
Notably, large financial institutions continue to advance their crypto businesses, with Visa, BlackRock, Google, and Coinbase participating in the Open USD stablecoin project, showing that traditional finance and tech giants have not abandoned crypto infrastructure construction. Uncertainty remains regarding the US crypto market structure bill, and the market has re-evaluated the likelihood of the Clarity Act passing this year. While regulatory progress can improve long-term valuations, it has yet to form a clear catalyst in the short term.
Bitcoin Price Trend Analysis: $58,000 Becomes Key Pivot Point for Bulls and Bears
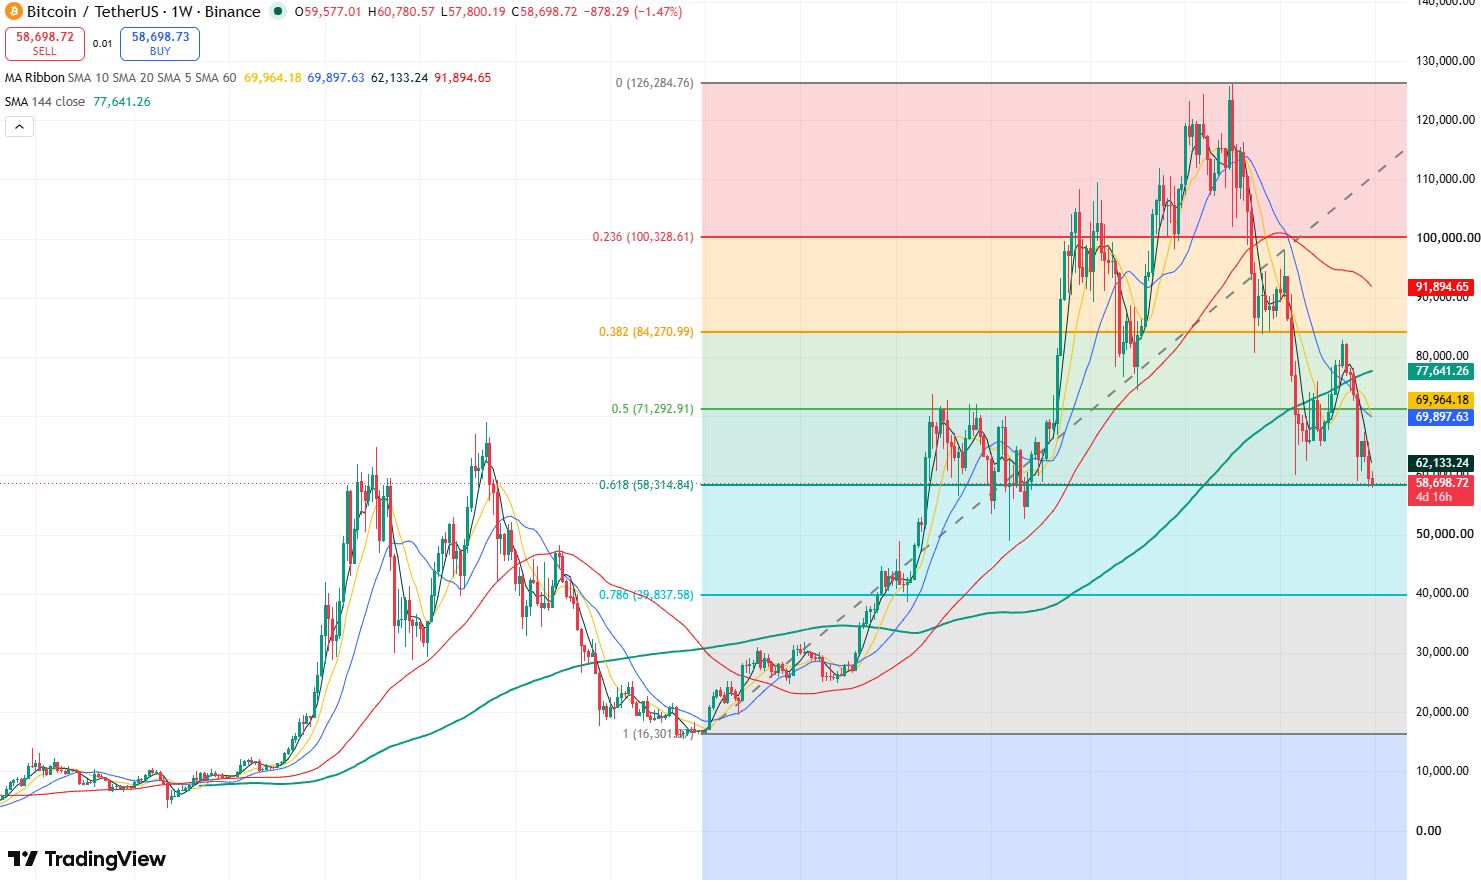
Bitcoin price weekly chart. Source: TradingView
Looking at Bitcoin's weekly chart, its candlestick pattern since the beginning of this year shows a clear trend of lower highs and lower lows, indicating that the overall trend of Bitcoin remains downward. As the Bitcoin price fell below the 70,000 threshold, shorting momentum in the market has been significantly enhanced.
Meanwhile, with the candlestick confirming a break below the SMA144, Bitcoin's medium-to-long-term bullish trend has been broken, meaning market sentiment has shifted to the bearish side, which further strengthens bearish momentum.
Currently, the Bitcoin price has dropped to near the Fibonacci 0.618 retracement level of $58,000. If the Bitcoin price stabilizes above this level, it will experience a technical corrective rebound in the short term. However, as the overall trend remains biased toward the bears, the upside potential for Bitcoin's rebound may be limited. The primary target for a Bitcoin rebound is $63,000; if it breaks above this level, Bitcoin will further rebound toward $65,000.
On the downside, if the Bitcoin price is confirmed to fall below $58,000, the downside room for the Bitcoin price will be further opened up, with the potential to test $49,000-$50,000 downward.
In terms of trading strategy, it is recommended to wait for the Bitcoin price to rebound near the resistance levels to attempt shorting on rallies.
This content was translated using AI and reviewed for clarity. It is for informational purposes only.
Recommended Articles


Comments (0)
Click the $ button, enter the symbol, and select to link a stock, ETF, or other ticker.