

Ethereum Price Forecast: ETH ETF sees boost as bulls target descending channel resistance

Ethereum price today: $1,780
- Ethereum ETFs record their highest net inflows for the first time since February 4
- Ethereum exchanges have recorded over $150 million in inflows in the past two days.
- ETH saw a rejection at the 50-day SMA as bulls eyes a key descending channel's resistance.
Ethereum (ETH) gained 2% on Wednesday after US spot Ether ETFs recorded their largest inflows since February 4. However, the top altcoin could face a correction after experiencing a rejection at its 50-day Simple Moving Average (SMA).
ETH ETFs sees increased inflows amid selling activity in spot exchanges
Following ETH's impressive 13% rise on Tuesday, institutional investors flipped bullish, sparking a $38.8 million net inflow into US spot Ether ETFs. This marks their first net inflow since April 4 and their largest inflow since February 4.
Fidelity's FETH and Bitwise's ETHW were responsible for the flows, recording inflows of $32.7 million and $6.1 million, respectively.
The inflows come at a critical time when ETH's dominance declined to lows below 7%, and ETH ETFs nearly hit $1 billion in cumulative outflows since February 20. If investors sustain the inflows, it could boost ETH's price.
Despite the bullish signs in the market, spot investors appear to be leveraging the price rise to book profits as ETH's exchange net inflows have surged by over $150 million in the past two days, per Coinglass data.
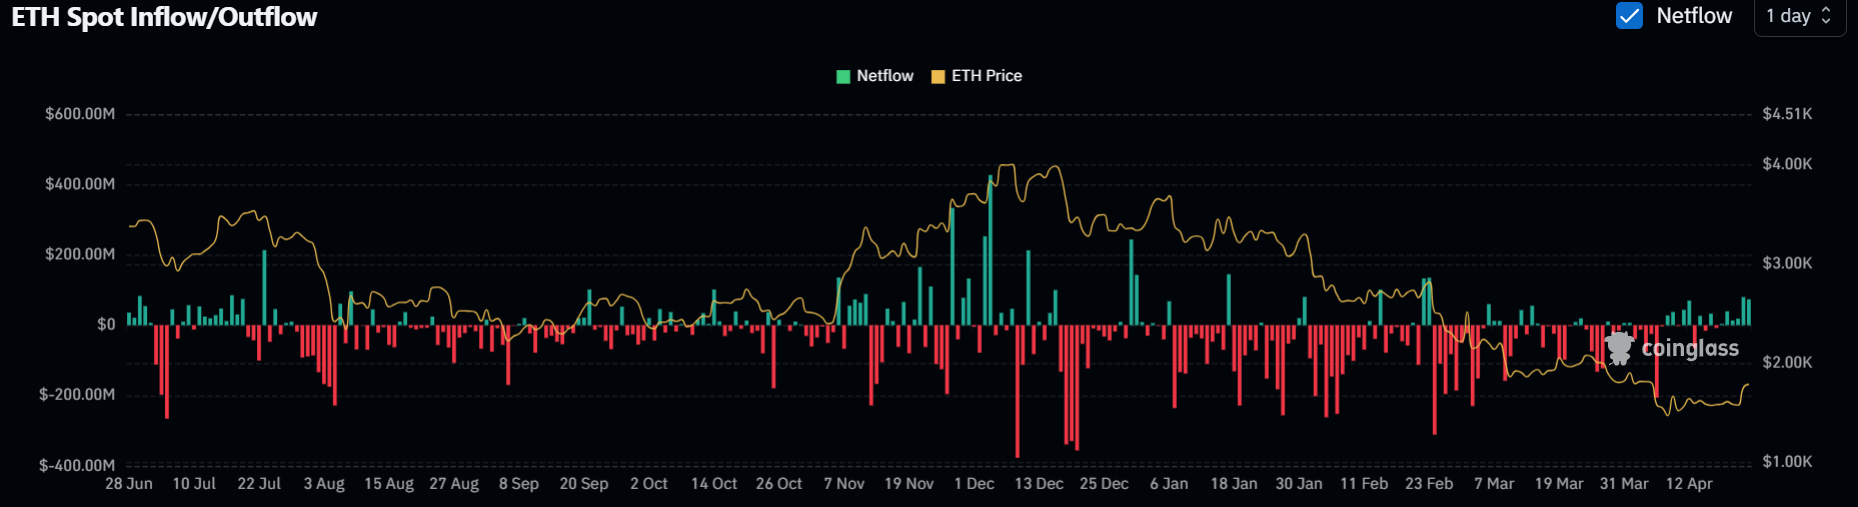
ETH exchange net flows. Source Coinglass
The latest developments surrounding ETH come amid its upcoming Pectra upgrade on May 7. The upgrade will introduce several features to the Ethereum mainnet including wallet recovery options, transaction batching, blobspace expansion and increasing the staking limit to 2,048 ETH.
Ethereum Price Forecast: ETH sees rejection at the 50-day SMA
Ethereum saw $81.82 million in futures liquidations in the past 24 hours, per Coinglass data. The total amount of long and short liquidations is $30.72 million and $51.11 million, respectively.
ETH briefly surged above the resistance at $1,800 but saw a rejection at the 50-day SMA before it could test the upper boundary of a key descending channel. ETH has traded within this channel since December 16.
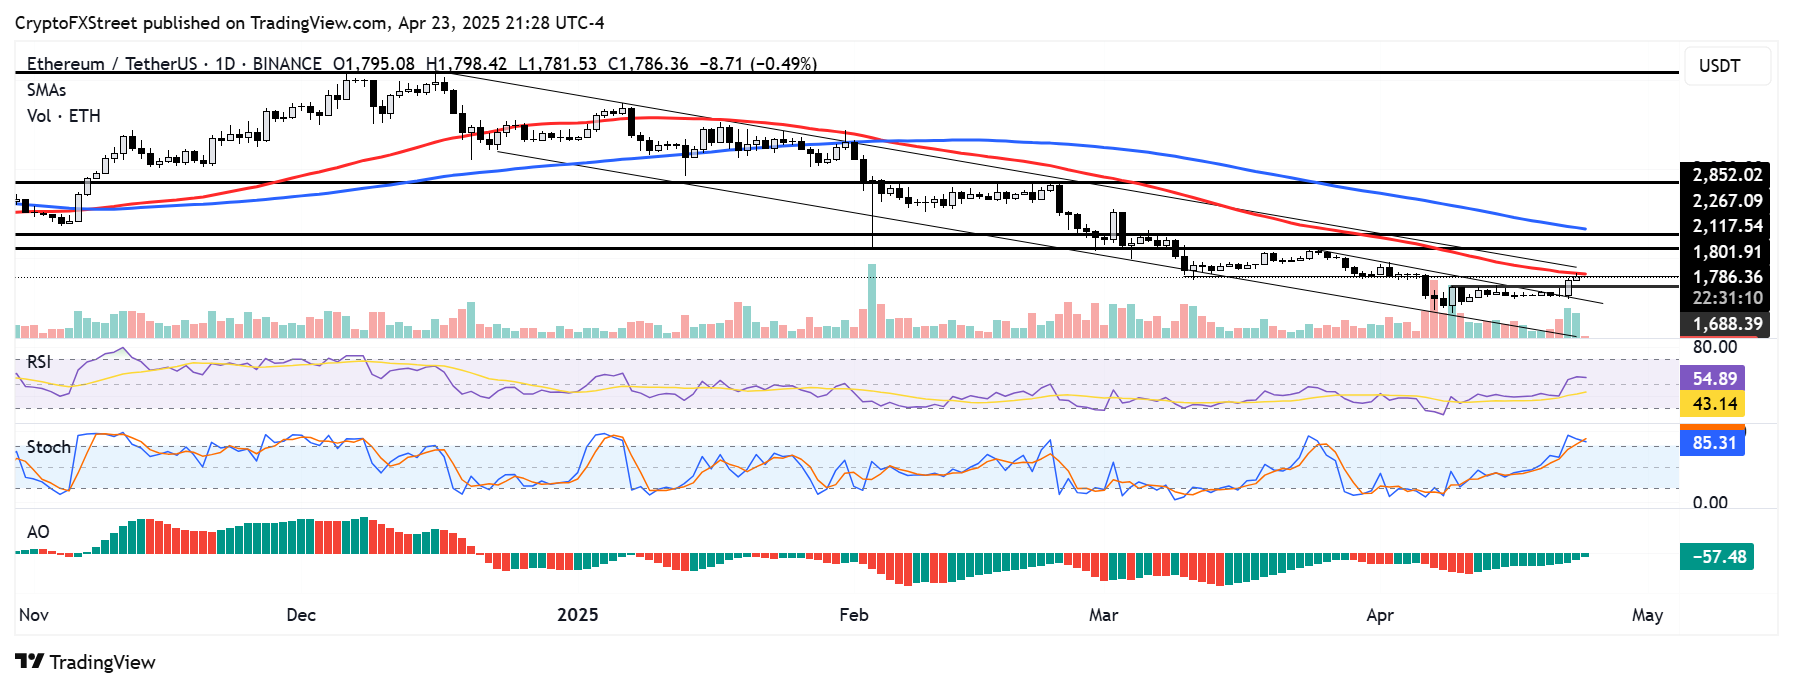
ETH/USDT daily chart
A move that flips the channel's upper boundary into a support level could strengthen the bullish pressure and send ETH to reclaim the $2,000 psychological level.
On the downside, ETH must hold the $1,688 level as support to maintain a bullish bias.
The Relative Strength Index (RSI) is above its neutral level, and the Awesome Oscillator is posting receding green bars below its neutral level. A cross above will strengthen the bullish momentum. Meanwhile, the Stochastic Oscillator (Stoch) has crossed into the overbought region, indicating ETH could see a correction in the near term.
Recommended Articles


Comments (0)
Click the $ button, enter the symbol, and select to link a stock, ETF, or other ticker.