


USD/JPY tests 143.00 amid easing Fed fears and trade optimism



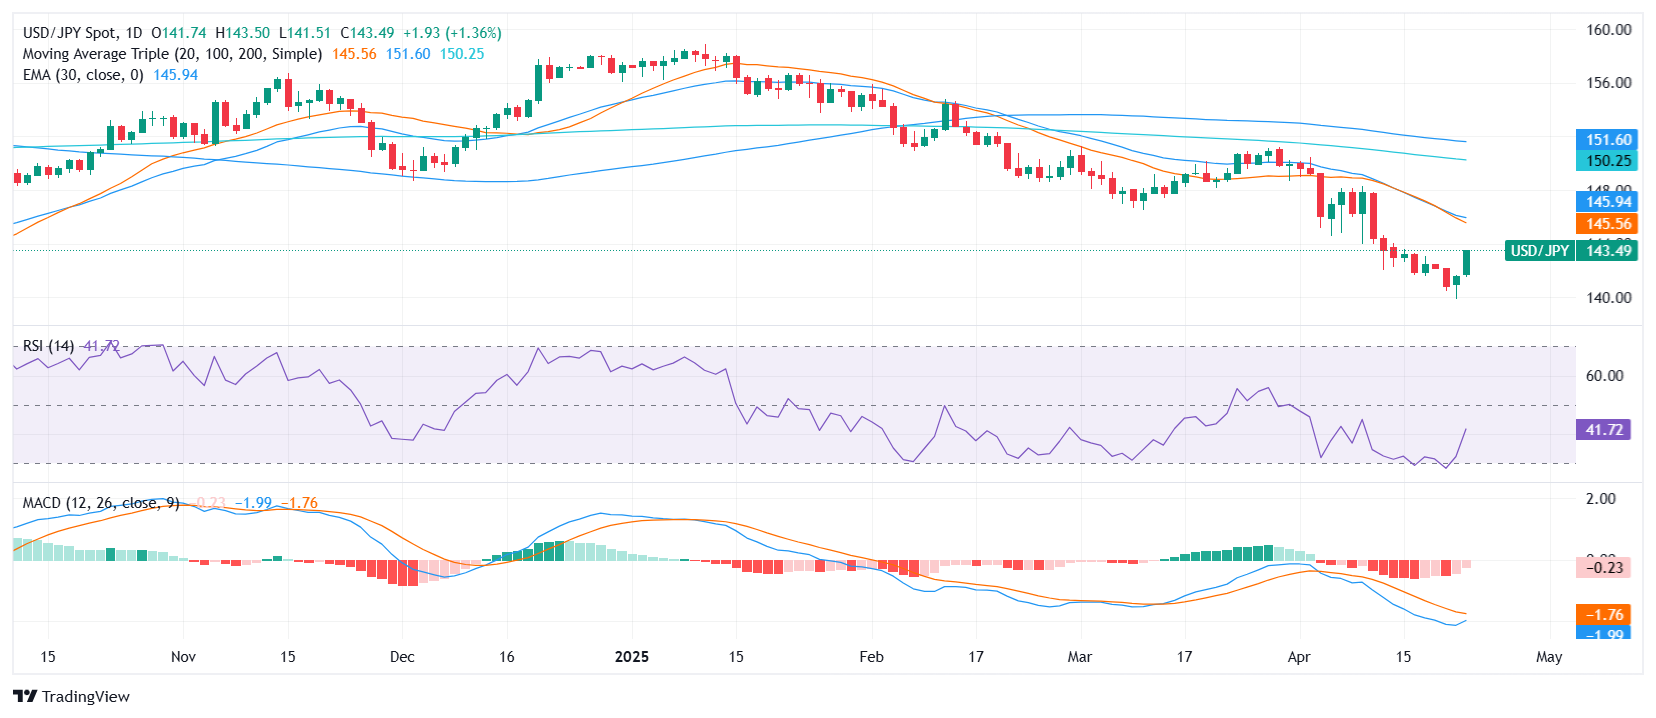
- USD/JPY jumps 1.24% to reclaim 143.00 as risk sentiment improves.
- DXY recovery stalls near 99.50 following weak PMI and tariff remarks.
- Technical indicators remain bearish despite intraday momentum.
The USD/JPY pair trades near the 143.00 mark on Wednesday, up over 1.2% on the day, extending its rebound from midweek lows. The Greenback’s gains are driven by improving risk appetite and signs that US-China trade tensions could ease. Aided by US President Donald Trump’s reassurance that Fed Chair Jerome Powell will remain in his post and by remarks from Treasury Secretary Scott Bessent suggesting tariff rates are unsustainable, the US Dollar (USD) staged a recovery from its three-year lows.
However, the underlying tone remains cautious. The S&P Global Composite PMI for April fell to 51.2 from 53.5, confirming slowing business momentum. The Services PMI dropped sharply to 51.4 from 54.4, while the Manufacturing PMI edged up slightly to 50.7. The Fed’s Beige Book echoed those concerns, noting slowing wage growth and persistent inflation due to tariff-driven input cost pressures. These reports reaffirm investor doubts about the economy’s strength, especially as the Fed balances rising inflation with waning activity.
Markets initially welcomed Bessent’s comments and the White House’s potential openness to reducing tariffs. However, equities gave back early gains, and the DXY failed to hold above 99.50, suggesting that the Greenback’s upside remains fragile.
Technical Analysis
From a technical standpoint, USD/JPY remains bearish despite today’s rally. The pair is trading near the top of its daily range (141.45–143.49), but indicators remain soft. The Relative Strength Index (RSI) is neutral at 41.21, and the MACD prints a sell signal. The Bull Bear Power at -2.356 and Commodity Channel Index at -64.788 are both neutral. Key moving averages also lean bearish: the 20-day SMA (145.52), 100-day SMA (151.45), and 200-day SMA (150.24) are all trending lower, confirmed by the 30-day EMA (145.91) and SMA (146.77).
Immediate support is located at 143.11, followed by 142.62 and 141.57. Resistance levels are seen at 144.72, 145.52, and 145.54. The pair may struggle to clear these zones unless macro conditions shift decisively in favor of the USD.
With lingering doubts over the Fed’s autonomy and mixed macro data, the USD/JPY outlook remains capped, even as risk-on flows provide temporary support.
Recommended Articles









Comments (0)
Click the $ button, enter the symbol, and select to link a stock, ETF, or other ticker.