


Altcoins to watch this week: ONDO and SUI bulls aim for double-digit gains



- Ondo and Sui prices gain nearly 5% on Monday after a slight decline in the previous week.
- Both altcoins are approaching their key resistance levels; a breakout would indicate a bullish rally ahead.
- ONDO and SUI MACD indicators display a bullish crossover, indicating an upward trend.
Ondo (ONDO) and SUI (SUI) prices gain nearly 5% at the time of writing on Monday, after a slight decline in the previous week. Both altcoins are approaching their key resistance levels; a breakout would indicate a bullish rally ahead. Moreover, their Moving Average Convergence Divergence (MACD) indicator displays a bullish crossover, indicating an upward trend.
Ondo bulls aiming for the $1.02 mark
Ondo price retested and found support on the previously broken descending trendline (drawn by connecting multiple highs since mid-December) on Wednesday and rose by 4.6% until Saturday. It declined slightly on Sunday. At the time of writing on Monday, ONDO trades higher by nearly 5%, at around $0.87.
If ONDO continues its upward trend and closes above the 50-day Exponential Moving Average (EMA) at $0.89, it could extend the rally by 14% to retest its next resistance level at $1.02, the 200-day EMA. A successful close above this level could extend an additional rally to retest its March 6 high of $1.20.
The Relative Strength Index (RSI) stands at 53, indicating slight bullish momentum, as it is positioned above its neutral level of 50. Moreover, the MACD indicator exhibited a bullish crossover last week, signaling a buying opportunity and an upward trend.
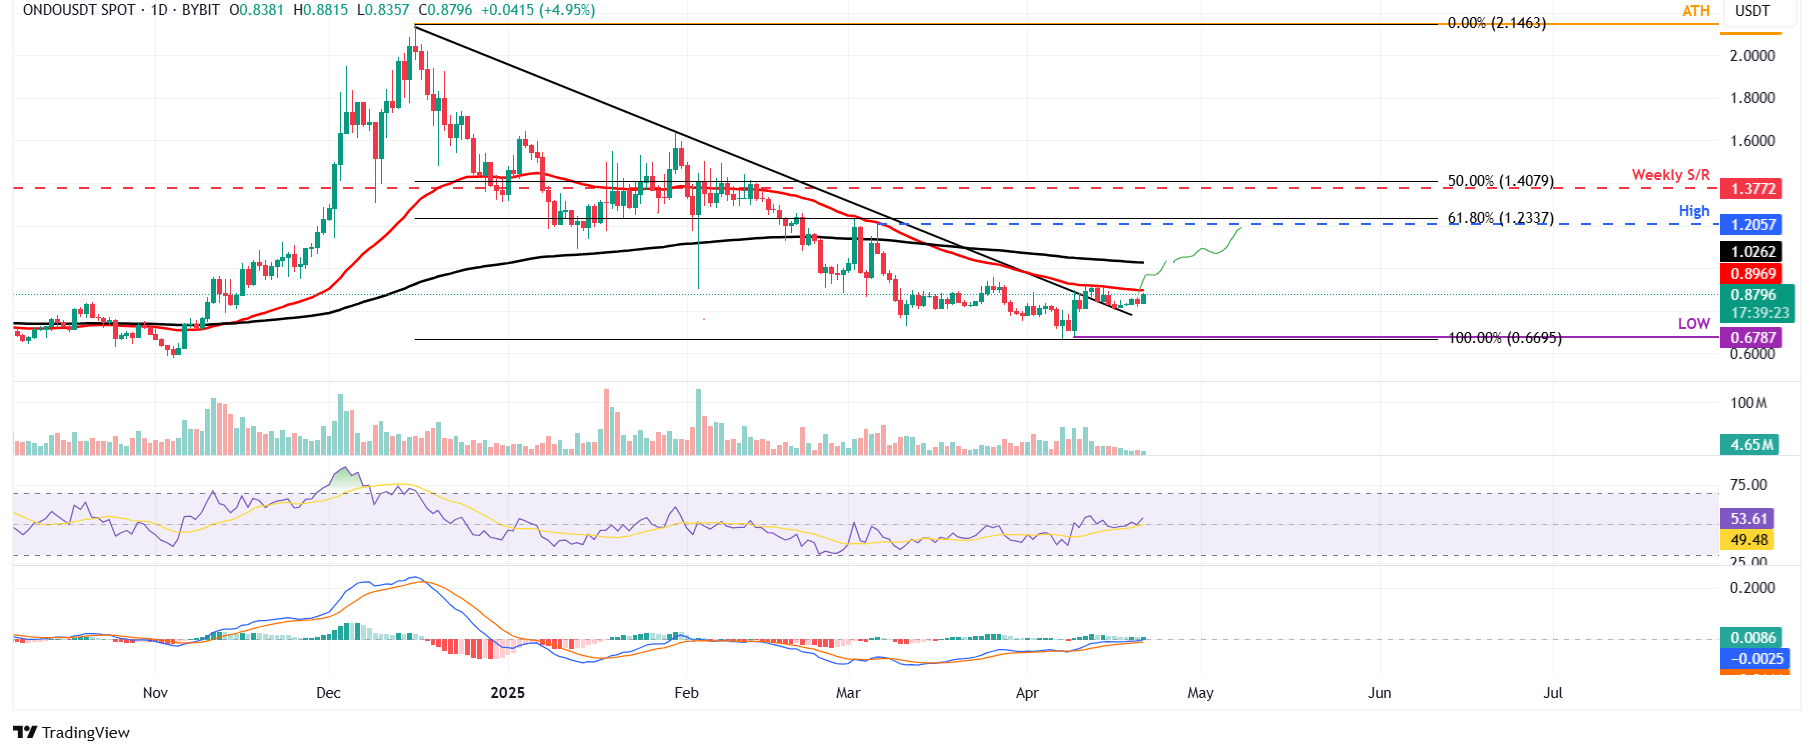
ONDO/USDT daily chart
However, if ONDO fails to close above its 50-day EMA and decline, it could extend the correction to retest its April 9 low of $0.68.
Sui could rally if it closes above its resistance level at $2.34
Sui price faced rejection around its descending trendline (drawn by connecting multiple highs since early January) on April 13 and declined 10.10% until Sunday. At the time of writing on Monday, SUI trades higher by 5% at $2.22, breaking above this trendline.
If Sui breaks above its descending trendline and closes above its weekly level of $2.34, it could extend the rally by 30% from its current level, potentially retesting its next resistance level at $2.90.
The RSI on the daily chart reads 50 but points upward, indicating fading bearish momentum. The RSI must move above its neutral level of 50 for the bullish momentum to be sustained. The MACD indicator also displayed a bullish crossover last week, signaling a potential buy opportunity and an upward trend.
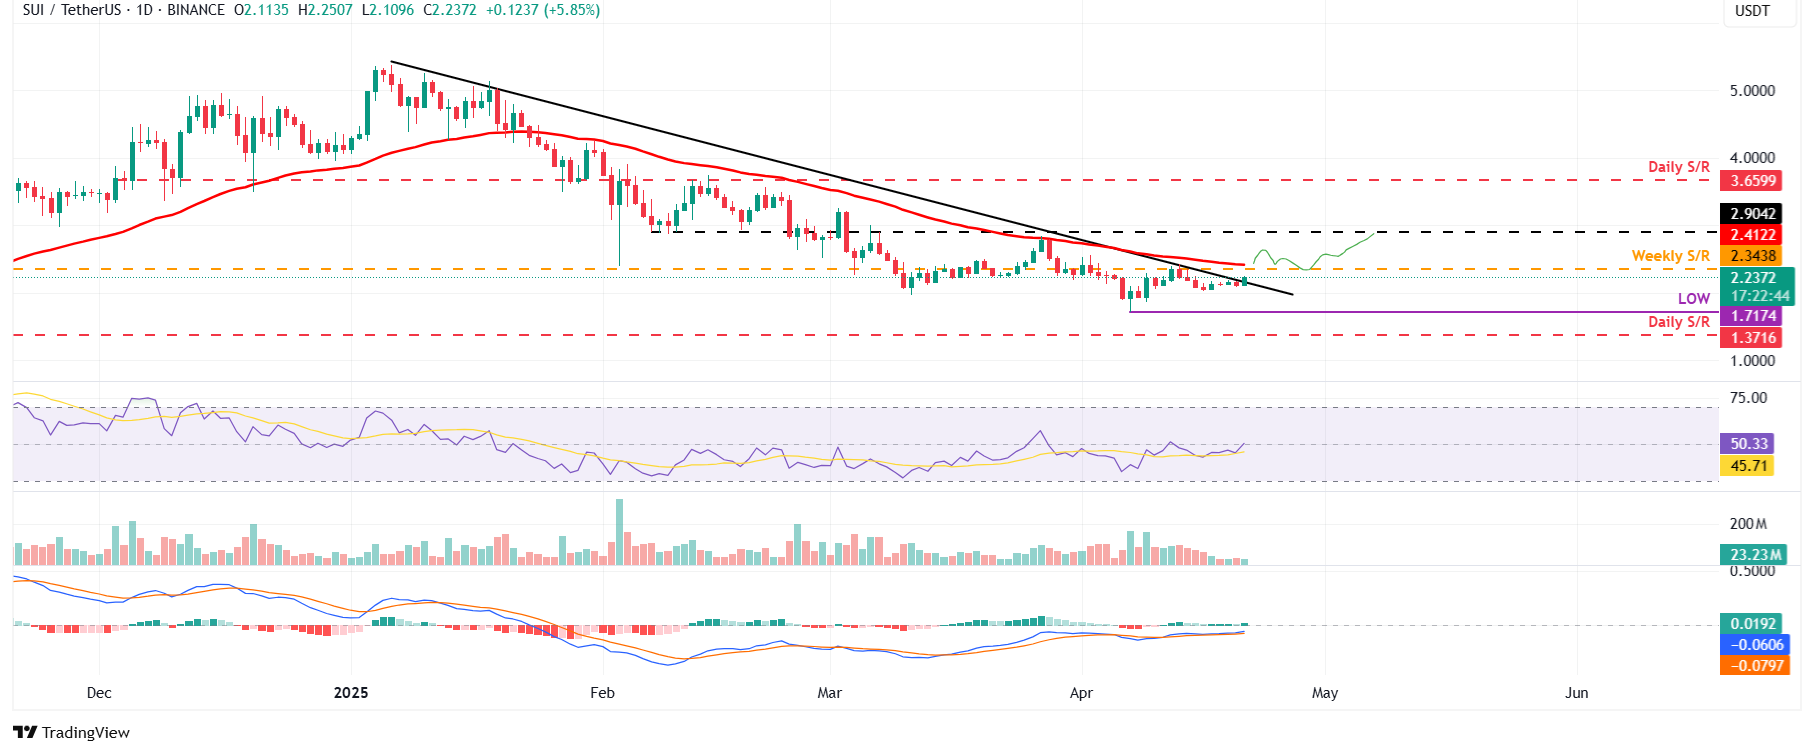
SUI/USDT daily chart
However, if Sui price faces a correction, it could extend the decline to retest its April 7 low of $1.71.
Recommended Articles









Comments (0)
Click the $ button, enter the symbol, and select to link a stock, ETF, or other ticker.