


The Stock Market Is Doing Something Witnessed Only 3 Times in 153 Years -- and History Is Very Clear What Happens Next



In case you haven't noticed, the bulls are firmly in charge on Wall Street. Since 2024 began, the iconic Dow Jones Industrial Average (DJINDICES: ^DJI), broad-based S&P 500 (SNPINDEX: ^GSPC), and innovation-fueled Nasdaq Composite (NASDAQINDEX: ^IXIC) have respectively gained 17%, 26%, and 28% (as of the closing bell on Nov. 13) and ascended to multiple record-closing highs.
A number of factors are responsible for pushing Wall Street's major stock indexes to new highs, including excitement for the artificial intelligence (AI) revolution, stock-split euphoria, and optimism for President-Elect Donald Trump's second term in the Oval Office.
But when things seem too good to be true on Wall Street, they usually are.

Image source: Getty Images.
The stock market has done this only three times since January 1871
Throughout the year, there have been an assortment of correlative events, forecasting tools, and data points that have warned of potential weakness in the U.S. economy and/or stock market. This includes the first notable decline in U.S. M2 money supply since the Great Depression, the longest yield-curve inversion in history, and the correlative performance of equities when the Federal Reserve shifts to a rate-easing cycle.
However, one historically flawless valuation metric stands head and shoulders above these other tools, and it's doing something right now that's only been observed three times in more than 150 years.
Most investors are probably familiar with or rely on the traditional price-to-earnings (P/E) ratio, which divides a company's share price into its trailing-12-month earnings per share (EPS). The P/E ratio provides a relatively quick way to compare a company's valuation to its peers or the broader market.
However, the traditional P/E ratio also has limitations. Specifically, it doesn't work particularly well with growth stocks since it doesn't factor in future growth rates, and it can be easily disrupted by shock events, such as the lockdowns that occurred during the early stages of the COVID-19 pandemic.
A considerably more encompassing valuation tool, and the metric currently making history, is the S&P 500's Shiller P/E ratio, also referred to as the cyclically adjusted P/E ratio or CAPE Ratio. The Shiller P/E accounts for average inflation-adjusted EPS from the previous 10 years, which smooths out the impact of shock events and allows for apples-to-apples valuation comparisons looking back more than 150 years.
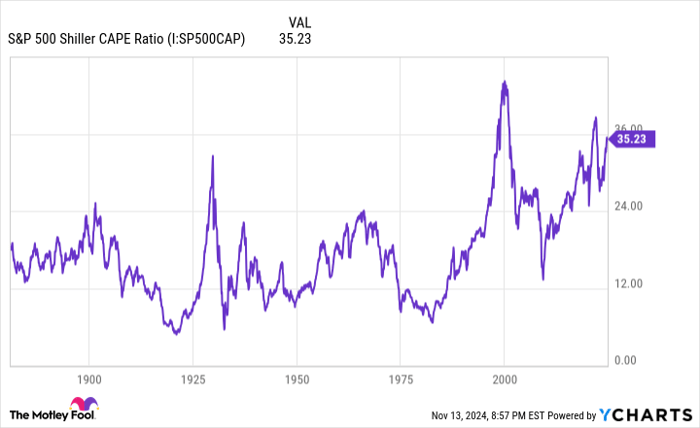
S&P 500 Shiller CAPE Ratio data by YCharts.
As of the closing bell on Nov. 13, the S&P 500's Shiller P/E clocked in at 38.18, more than double its average reading of 17.17 when back-tested to January 1871.
But more importantly, the Shiller P/E ratio has reached a reading of 38 only three times during a bull market rally in 153 years. In December 1999, during the dot-com boom, the Shiller P/E peaked at a reading of 44.19. Meanwhile, in the first week of 2022, it very briefly lifted above 40.
What's noteworthy is what's happened to Wall Street's major stock indexes following these prior periods when valuations became very clearly overextended to the upside. The dot-com bubble resulted in a peak-to-trough drop of 49% in the S&P 500 and a considerably steeper decline in the Nasdaq Composite. Meanwhile, the Dow Jones, S&P 500, and Nasdaq Composite entered respective bear markets in 2022.
Stepping back even further, there have been only six instances since 1871 when the Shiller P/E surpassed 30, including the present. Following each of the five prior occurrences, the Dow, S&P 500, and/or Nasdaq Composite eventually fell between 20% and 89%.
Although the Shiller P/E tells us nothing about when stock market corrections/bear markets might occur, thus far, it has a flawless track record of foreshadowing major moves lower in the stock market.

Image source: Getty Images.
Perspective changes everything on Wall Street
Based on what history tells us, at some point in the not-too-distant future, we're going to see a pretty sizable move lower in the Dow Jones Industrial Average, S&P 500, and Nasdaq Composite. But if you're a long-term investor looking to the horizon, history has a message for you, as well: Perspective changes everything.
Over shorter time frames, predicting what the U.S. economy or stock market will do can be tricky, if not downright impossible. For example, recessions are a normal and inevitable part of the economic cycle. No matter how much we cross our fingers and think good thoughts, economic contractions are eventually going to occur.
But here's the thing about recessions: They're short-lived. If you take a step back and look at the bigger picture, you'll see that nine out of 12 recessions following World War II resolved in less than a year, while the remaining three failed to surpass 18 months in length.
On the other end of the spectrum, two economic expansions have reached the 10-year mark since World War II ended. The point being that the U.S. economy spends considerably more time in the sun than navigating through a storm -- but you have to take a step back to see this dynamic play out.
The same holds true on Wall Street.
It's official. A new bull market is confirmed.
-- Bespoke (@bespokeinvest) June 8, 2023
The S&P 500 is now up 20% from its 10/12/22 closing low. The prior bear market saw the index fall 25.4% over 282 days.
Read more at https://t.co/H4p1RcpfIn. pic.twitter.com/tnRz1wdonp
The data set you see above was posted on social media platform X in June 2023 by the researchers at Bespoke Investment Group. It shows the calendar-day length of every bear and bull market in the benchmark S&P 500 dating back to the start of the Great Depression in September 1929.
As you'll note from the table, the average S&P 500 bear market decline is only 286 calendar days, roughly 9.5 months. This is consistent with downturns in the U.S. economy resolving quickly.
On the other hand, the average S&P 500 bull market over 94 years has endured for 1,011 calendar days, which equates to around two years and nine months. Including the current bull market rally, just over half (14 out of 27) of all bull markets for the S&P 500 have lasted longer than the lengthiest bear market.
Even though stock market downturns are normal and inevitable, perspective demonstrates just how powerful patience can be for long-term investors.
Should you invest $1,000 in S&P 500 Index right now?
Before you buy stock in S&P 500 Index, consider this:
The Motley Fool Stock Advisor analyst team just identified what they believe are the 10 best stocks for investors to buy now… and S&P 500 Index wasn’t one of them. The 10 stocks that made the cut could produce monster returns in the coming years.
Consider when Nvidia made this list on April 15, 2005... if you invested $1,000 at the time of our recommendation, you’d have $870,068!*
Stock Advisor provides investors with an easy-to-follow blueprint for success, including guidance on building a portfolio, regular updates from analysts, and two new stock picks each month. The Stock Advisor service has more than quadrupled the return of S&P 500 since 2002*.
*Stock Advisor returns as of November 11, 2024
Sean Williams has no position in any of the stocks mentioned. The Motley Fool has no position in any of the stocks mentioned. The Motley Fool has a disclosure policy.
Recommended Articles








Comments (0)
Click the $ button, enter the symbol, and select to link a stock, ETF, or other ticker.