


 Discount


Citigroup Inc Stock (C) Moved Down by 3.23% on Nov 20: What Investors Need To Know


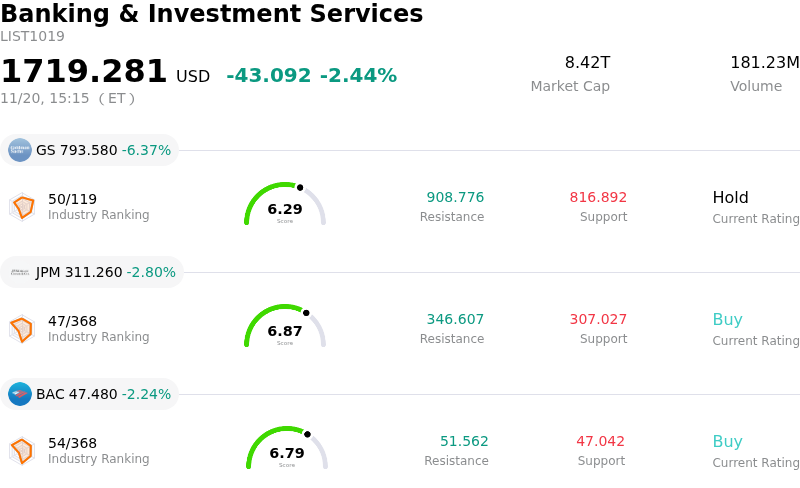
Citigroup Inc (C) moved down by 3.23%. The Banking & Investment Services sector is down by 2.44%. The company underperformed the industry. Top 3 stocks by turnover in the sector: Goldman Sachs Group Inc (GS) down 6.37%; JPMorgan Chase & Co (JPM) down 2.80%; Bank of America Corp (BAC) down 2.22%.
What is driving Citigroup Inc (C)’s stock price down today?
Citigroup encountered notable downward pressure during the trading session, reflecting a confluence of macroeconomic crosscurrents, sector-wide risk aversion, and persistent institutional scrutiny surrounding the bank's operational turnaround. The broader banking sector experienced synchronized weakness as shifting macroeconomic data prompted investors to recalibrate their expectations regarding the interest rate trajectory and credit cycle dynamics.
A primary catalyst weighing on Citigroup was the renewed focus on net interest margin compression and asset quality across large-cap money center banks. With benchmark sovereign yields adjusting to evolving monetary policy projections, market participants showed heightened concern over deposit beta dynamics and funding costs. For Citigroup, which maintains a substantial consumer banking and branded cards footprint, rising delinquency trends in retail credit have reinforced expectations of elevated provisions for credit losses. When broader risk sentiment deteriorates, institutions with larger exposures to credit-sensitive consumer segments frequently face heightened selling pressure.
Company-specific strategic considerations also amplified intraday volatility. While management continues to execute its multi-year organizational simplification and operational restructuring, institutional investors remain highly sensitive to progress on consent order remediations and regulatory compliance costs. The bank's ongoing investments in data governance, risk management infrastructure, and technological modernization continue to elevate non-interest expenses, limiting near-term operating leverage. Any emerging industry-wide drag on investment banking advisory fees or trading desk performance further tempers enthusiasm for Citigroup's return on tangible common equity targets.
In addition, institutional portfolio adjustments contributed to the pullback. Quantitative and systematic funds exhibited sector-level de-risking, trimming cyclical financial holdings in favor of more defensive asset classes amid elevated broader market volatility. Given Citigroup's relatively high beta within the universal banking peer group, institutional rebalancing often triggers outsized pullbacks during sector-wide downturns.
Looking ahead, Citigroup's performance will remain closely tethered to credit loss trajectory management, expense discipline amid ongoing restructuring, and the stabilization of institutional client revenues. In the short term, the market is pricing in a cautious stance on credit normalization and execution complexity, requiring clear evidence of sustained operating efficiency and robust capital return to regain upward momentum.
Technical Analysis of Citigroup Inc (C)
Technically, Citigroup Inc (C) shows a MACD (12,26,9) value of -1.511, indicating a sell signal. The RSI at 29.060 suggests sell condition and the Williams %R at 94.388 suggests oversold condition. Please monitor closely.
Media Coverage of Citigroup Inc (C)
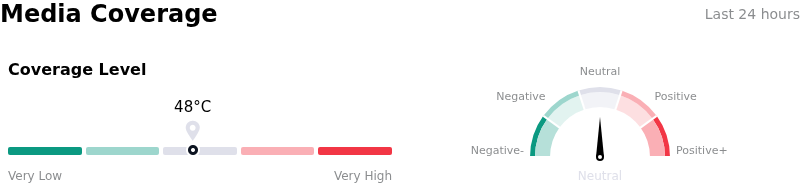
In terms of media coverage, Citigroup Inc (C) shows a coverage score of 48, indicating a moderate level of media attention. The overall market sentiment index is currently in neutral zone.
Fundamental Analysis of Citigroup Inc (C)
Citigroup Inc (C) is in the Banking & Investment Services industry. Its latest annual revenue is $81.18B, ranking 4 in the industry. The net profit is $13.02B, ranking 3 in the industry. Company Profile
Over the past month, multiple analysts have rated the company as Buy, with an average price target of $150.82, a high of $170.00, and a low of $131.69.
More details about Citigroup Inc (C)
Company Specific Risks:
- $35 Billion Risk-Weighted Asset Modeling Error: Intraday selling pressure surged following reports that Citigroup miscalculated and understated risk-weighted assets by approximately $35 billion at its UK trading unit due to the use of an unapproved internal model, forcing the bank to inject unexpected capital into the subsidiary to restore required regulatory buffers.
- Regulatory Remediation and Consent Order Complications: The disclosure of internal modeling and trade-booking failures threatens to derail management's efforts to lift outstanding 2020 Federal Reserve and OCC consent orders, renewing fears of regulatory scrutiny, prolonged oversight, and potential fines following earlier multi-million-dollar penalties for data governance and risk control deficiencies.
- Analyst Target Reductions on Lingering Operational Overhead: Institutional research desks, including RBC Capital and TD Cowen, lowered their price targets and tempered outer-year expectations, citing persistent strategic execution friction, internal control lapses, and management's projected sequential drop of roughly 20% in Markets revenue.
- Elevated Intraday Volatility and Bearish Derivatives Hedging: Market confidence deteriorated sharply as put-option trading volume spiked more than 110% above normal levels, reflecting intensified institutional hedging and immediate capital concerns tied to recurring controls failures.
This article may include AI-generated content that is human-reviewed, which is for reference and general information purposes only and does not constitute investment advice.
Recommended Articles







Comments (0)
Click the $ button, enter the symbol, and select to link a stock, ETF, or other ticker.