


 Discount


Goldman Sachs Group Inc Stock (GS) Moved Down by 5.50% on Nov 20: Drivers Behind the Movement


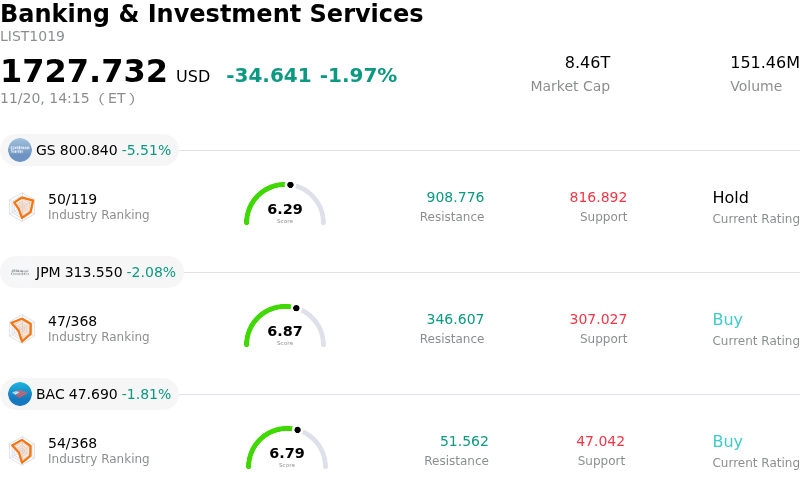
Goldman Sachs Group Inc (GS) moved down by 5.50%. The Banking & Investment Services sector is down by 1.97%. The company underperformed the industry. Top 3 stocks by turnover in the sector: Goldman Sachs Group Inc (GS) down 5.51%; JPMorgan Chase & Co (JPM) down 2.10%; Bank of America Corp (BAC) down 1.80%.
What is driving Goldman Sachs Group Inc (GS)’s stock price down today?
Shares of Goldman Sachs experienced pronounced downward pressure as a confluence of macroeconomic crosscurrents, institutional de-risking, and heightened scrutiny over capital markets activity weighed heavily on the diversified financial heavyweight. Large-cap financial institutions faced broad-based selling, but Goldman Sachs bore an amplified impact due to its high beta and substantial exposure to advisory, underwriting, and institutional trading revenues, which remain particularly sensitive to shifts in market volatility and corporate risk appetite.
A primary catalyst behind the retreat is growing institutional concern regarding the near-term recovery trajectory of investment banking and mergers and acquisitions. While advisory pipelines had shown signs of stabilization, emerging regulatory friction, antitrust reviews, and higher financing costs have reintroduced friction into large-scale transaction closures. Furthermore, heightened scrutiny around private equity real estate marks and alternative investments within the Asset and Wealth Management segment continues to pose valuation headwinds, raising investor concerns over potential principal investment impairments and sluggish management fee acceleration.
Macroeconomic developments have added further pressure to the financial sector. Shifting expectations surrounding Federal Reserve monetary policy, alongside volatility in benchmark sovereign bond yields, have complicated the operating backdrop for fixed income, currency, and commodities market-making desks. Widening credit spreads and turbulent debt capital markets often compress underwriting volumes and reduce institutional client activity. Concurrently, ongoing updates regarding capital adequacy standards and regulatory capital buffers under finalized Basel frameworks have prompted institutional desks to reassess capital return capacity, curbing expectations for aggressive share repurchases and balance sheet flexibility.
From a positioning standpoint, the sharp intraday retreat triggered systematic institutional rebalancing and risk-parity selling across the financial services sector. Elevated hedging activity in equity derivatives and a broader pickup in risk aversion drove fund managers to trim cyclical and capital-markets-sensitive holdings in favor of more defensive asset classes. In addition, cautious commentary from industry peers regarding institutional fee momentum has catalyzed tactical profit-taking following previous cyclical gains.
Looking ahead, institutional investors will be monitoring the resilience of Goldman Sachs’ Global Banking and Markets segment, particularly institutional trading velocity and backlogged advisory completions, as well as progress in operational cost discipline. While the firm retains premier structural positioning across global capital markets, near-term equity performance is likely to remain dictated by macro volatility, credit market conditions, and visibility into private asset valuations.
Technical Analysis of Goldman Sachs Group Inc (GS)
Technically, Goldman Sachs Group Inc (GS) shows a MACD (12,26,9) value of -15.588, indicating a sell signal. The RSI at 30.464 suggests neutral condition and the Williams %R at 98.369 suggests oversold condition. Please monitor closely.
Media Coverage of Goldman Sachs Group Inc (GS)
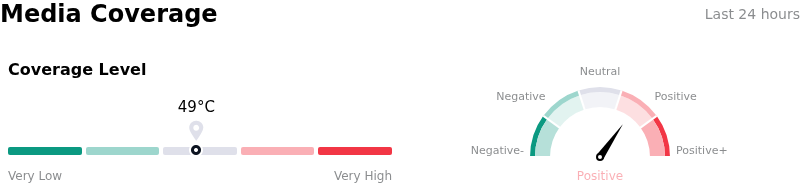
In terms of media coverage, Goldman Sachs Group Inc (GS) shows a coverage score of 49, indicating a moderate level of media attention. The overall market sentiment index is currently in bullish zone.
Fundamental Analysis of Goldman Sachs Group Inc (GS)
Goldman Sachs Group Inc (GS) is in the Banking & Investment Services industry. Its latest annual revenue is $117.10B, ranking 2 in the industry. The net profit is $16.30B, ranking 1 in the industry. Company Profile
Over the past month, multiple analysts have rated the company as Hold, with an average price target of $1045.75, a high of $1250.00, and a low of $875.00.
More details about Goldman Sachs Group Inc (GS)
Company Specific Risks:
- Regulatory Capital Buffer Compression: An expansion in risk-weighted assets has tightened Goldman Sachs' Common Equity Tier 1 (CET1) ratio down to 12.4%, leaving approximately a 100 basis point margin above its 11.4% regulatory requirement. This compressed cushion severely restricts capital return flexibility, raising analyst concerns over near-term share buyback volumes and dividend distributions.
- Structural Revenue Over-Reliance on Volatile Trading: Institutional analysts are flagging heightened earnings fragility due to overconcentration in cyclical equities and fixed-income trading operations, which constitute over half of total revenues. This heavy weighting exposes the bank to sharp top-line contractions and multiple compression if market turbulence, rate volatility, or trading volumes subside.
- Cash Flow Depletion and Preferred Equity Liquidity Drain: The bank faces mounting balance sheet pressure from persistently negative operating and free cash flow generation and elevated leverage, conditions exacerbated by SEC filings confirming the complete redemption and elimination of its Series O and Series V preferred stock, which directly removed liquidity buffers.
- Underwriting and Advisory Vulnerability to High Financing Costs: Elevated benchmark interest rates and yield curve volatility continue to threaten Goldman's core investment banking pipeline, directly amplifying executive warnings over elevated financing risks within debt underwriting and large-scale artificial intelligence infrastructure advisory deals.
This article may include AI-generated content that is human-reviewed, which is for reference and general information purposes only and does not constitute investment advice.
Recommended Articles





Comments (0)
Click the $ button, enter the symbol, and select to link a stock, ETF, or other ticker.