


 Discount


Amazon.com Inc Stock (AMZN) Moved Down by 3.03% on Nov 20: Drivers Behind the Movement


Amazon.com Inc (AMZN) moved down by 3.03%. The Retailers sector is down by 1.32%. The company underperformed the industry. Top 3 stocks by turnover in the sector: Amazon.com Inc (AMZN) down 3.03%; Home Depot Inc (HD) up 1.99%; Costco Wholesale Corp (COST) up 1.81%.
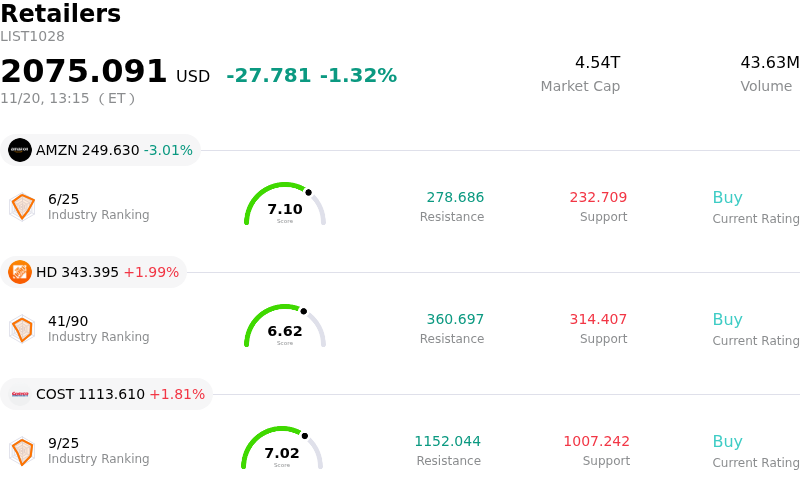
What is driving Amazon.com Inc (AMZN)’s stock price down today?
Amazon faced pronounced downward pressure as a broader risk-off rotation away from mega-cap technology equities weighed on market sentiment. Escalating concerns surrounding prolonged restrictive monetary policy and elevated benchmark Treasury yields have tightened discount rates, disproportionately impacting high-valuation growth names. Institutional investors appeared to de-risk portfolios ahead of pivotal economic data and critical holiday retail milestones, triggering widespread profit-taking across mega-cap tech bellwethers.
Underpinning this pullback are intensifying market anxieties regarding capital expenditure trajectories within the cloud and artificial intelligence segments. As Amazon continues to commit substantial capital toward data center expansion, custom silicon, and generative AI infrastructure, institutional allocators are scrutinizing near-term returns on invested capital. Lingering caution over enterprise IT budget constraints, alongside aggressive competitive pricing from rival hyperscalers, has amplified scrutiny around Amazon Web Services' operating margin trajectory in the coming quarters.
Concurrently, consumer-facing risks are coming into sharper focus as the market navigates the peak year-end retail season. Subdued discretionary consumer demand, the need for heightened promotional discounting to defend e-commerce market share, and potential margin compression from fulfillment and logistics operations are tempering retail profit expectations. While Amazon maintains durable competitive advantages across cloud infrastructure, digital advertising, and global logistics, the convergence of heightened AI capital intensity, macro interest rate sensitivity, and holiday retail margin concerns drove today's retreat.
Technical Analysis of Amazon.com Inc (AMZN)
Technically, Amazon.com Inc (AMZN) shows a MACD (12,26,9) value of -1.761, indicating a neutral signal. The RSI at 43.742 suggests neutral condition and the Williams %R at 88.153 suggests oversold condition. Please monitor closely.
Media Coverage of Amazon.com Inc (AMZN)
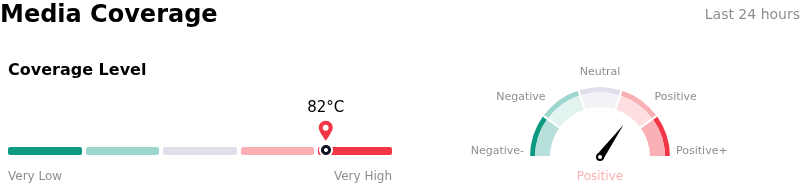
In terms of media coverage, Amazon.com Inc (AMZN) shows a coverage score of 82, indicating a very high level of media attention. The overall market sentiment index is currently in bullish zone.
Fundamental Analysis of Amazon.com Inc (AMZN)
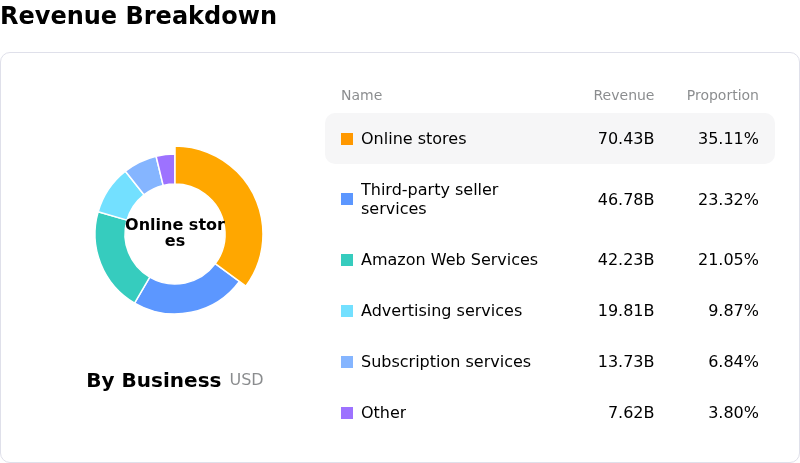
Amazon.com Inc (AMZN) is in the Retailers industry. Its latest annual revenue is $716.92B, ranking 1 in the industry. The net profit is $77.67B, ranking 1 in the industry. Company Profile
Over the past month, multiple analysts have rated the company as Buy, with an average price target of $323.05, a high of $405.00, and a low of $207.00.
More details about Amazon.com Inc (AMZN)
Company Specific Risks:
- Anthropic Post-IPO Volatility and Valuation Hangover: Following the public market debut of AI startup Anthropic—in which Amazon holds an approximate 14.6% equity stake—a steep intraday reversal and sell-off in Anthropic shares prompted institutional de-risking and proxy multiple compression across Amazon stock.
- Project Kuiper Launch Setbacks and FCC Compliance Deadlines: The operational timeline for Amazon's satellite broadband constellation faces acute execution pressure following the recent loss of 40 low Earth orbit satellites during a launch failure, threatening strict Federal Communications Commission requirements to deploy 1,600 operational satellites by mid-2026.
- Municipal Regulatory Pushback and Fulfillment Friction: Amazon escalated a direct consumer campaign against proposed New York City delivery legislation, warning shoppers of potential $5 per-order surcharges and threatening localized operational pullbacks, amplifying near-term regulatory and reputational liabilities.
- Severe Free Cash Flow Drain from High AI Capital Expenditure: Wall Street sentiment continues to reflect deep concern over multi-billion-dollar infrastructure spending forecasts approaching $220 billion, driving negative free cash flow alongside grid-power shortages and infrastructure export compliance burdens that hinder near-term cloud monetization.
This article may include AI-generated content that is human-reviewed, which is for reference and general information purposes only and does not constitute investment advice.
Recommended Articles








Comments (0)
Click the $ button, enter the symbol, and select to link a stock, ETF, or other ticker.