


 Discount


Morgan Stanley Stock (MS) Moved Down by 3.96% on Nov 20: What Signal Does It Send?


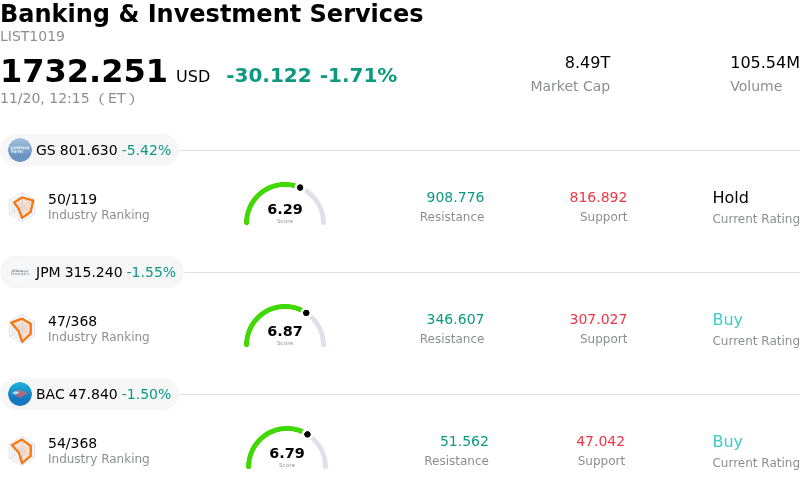
Morgan Stanley (MS) moved down by 3.96%. The Banking & Investment Services sector is down by 1.71%. The company underperformed the industry. Top 3 stocks by turnover in the sector: Goldman Sachs Group Inc (GS) down 5.44%; JPMorgan Chase & Co (JPM) down 1.55%; Bank of America Corp (BAC) down 1.50%.
What is driving Morgan Stanley (MS)’s stock price down today?
Morgan Stanley experienced broad-based selling pressure during the session as a confluence of macroeconomic headwinds, sector-wide rotation, and sensitivity across capital markets assets weighed heavily on investor sentiment. A sharp repricing in global rate expectations and volatility across sovereign debt yields triggered a broader retreat within the financial sector. With monetary policy uncertainty resurfacing, market participants actively scaled back exposure to diversified financials facing potential compression in net interest margins and fluctuating client cash allocations.
The firm's core operational pillars, particularly institutional securities and wealth management, heightened its vulnerability to deteriorating broader market conditions. A cautious macro backdrop creates near-term friction for advisory and underwriting pipelines, deferring the anticipated acceleration in debt and equity underwriting activity. Concurrently, broader equity market drawdowns and reduced risk appetite directly pressure Morgan Stanley's wealth management franchise, where asset-based fees and fee-based client asset valuations are intrinsically tied to broader market levels. Concerns over client cash sorting and moderating net new asset momentum further reinforced cautious positioning.
Institutional portfolio dynamics also exacerbated the downward momentum. Following a period of relative strength across large-cap investment banks, institutional managers engaged in tactical de-risking and profit-taking amid rising volatility benchmarks. Heightened hedging activity and systematic fund selling across diversified bank exchange-traded funds amplified the downward pressure, leaving Morgan Stanley exposed to elevated sector correlation rather than idiosyncratic company catalysts.
Moving forward, institutional investors will be monitoring the resilience of organic wealth management inflows, advisory deal conversion rates, and expense discipline amid macroeconomic crosscurrents. Until clarity emerges regarding the interest rate trajectory and capital market reopening momentum, the stock remains vulnerable to macro-driven sector volatility and broader risk-off sentiment.
Technical Analysis of Morgan Stanley (MS)
Technically, Morgan Stanley (MS) shows a MACD (12,26,9) value of -2.777, indicating a sell signal. The RSI at 31.531 suggests neutral condition and the Williams %R at 97.801 suggests oversold condition. Please monitor closely.
Media Coverage of Morgan Stanley (MS)
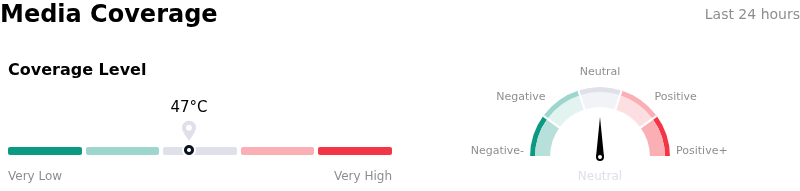
In terms of media coverage, Morgan Stanley (MS) shows a coverage score of 47, indicating a moderate level of media attention. The overall market sentiment index is currently in neutral zone.
Fundamental Analysis of Morgan Stanley (MS)
Morgan Stanley (MS) is in the Banking & Investment Services industry. Its latest annual revenue is $114.74B, ranking 3 in the industry. The net profit is $16.25B, ranking 2 in the industry. Company Profile
Over the past month, multiple analysts have rated the company as Buy, with an average price target of $214.10, a high of $262.00, and a low of $190.00.
More details about Morgan Stanley (MS)
Company Specific Risks:
- Wealth Management Cash Sweep Margin Compression: Net interest income within the core Wealth Management division faces ongoing margin erosion as regulatory scrutiny over cash sweep account yields pressures the firm to maintain higher client deposit payouts, directly elevating deposit funding costs and compressing net interest margins.
- Capital Markets and Advisory Pipeline Delays: Institutional Securities revenues remain vulnerable to conversion bottlenecks, as persistent yield curve volatility and corporate risk aversion lead institutional clients to postpone debt syndications, equity underwritings, and M&A deal closures.
- Supervisory Compliance Overhead and Regulatory Scrutiny: Heightened oversight and remediation mandates surrounding wealth management advisory controls, client vetting, and cash disbursement monitoring continue to inflate operational compliance expenditures while exposing the franchise to potential regulatory penalties.
This article may include AI-generated content that is human-reviewed, which is for reference and general information purposes only and does not constitute investment advice.
Recommended Articles









Comments (0)
Click the $ button, enter the symbol, and select to link a stock, ETF, or other ticker.