


 Discount


Exxon Mobil Corp Stock (XOM) Moved Down by 3.28% on Nov 18: A Full Analysis


Exxon Mobil Corp (XOM) moved down by 3.28%. The Energy - Fossil Fuels sector is down by 3.09%. The company underperformed the industry. Top 3 stocks by turnover in the sector: Exxon Mobil Corp (XOM) down 3.28%; Chevron Corp (CVX) down 3.38%; Marathon Petroleum Corp (MPC) down 4.41%.
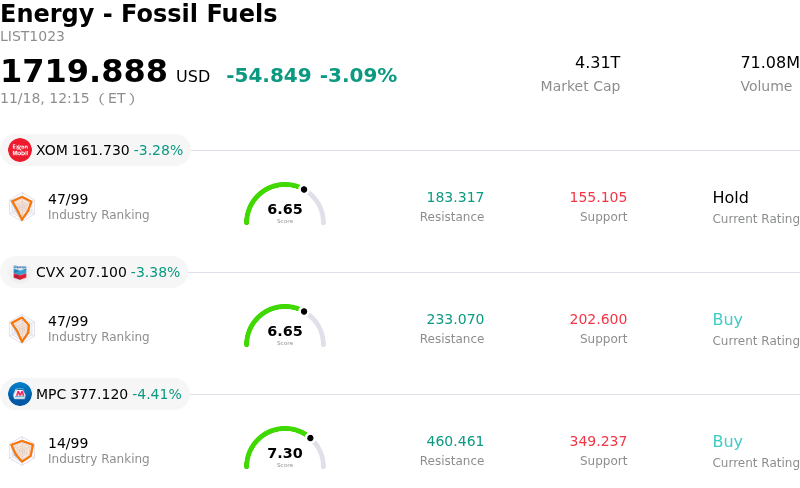
What is driving Exxon Mobil Corp (XOM)’s stock price down today?
Exxon Mobil experienced notable downward pressure during the session, driven primarily by a broader retreat across the energy complex as global crude oil benchmarks extended their recent slide. Renewed concerns regarding a widening global supply surplus, coupled with persistent inventory builds in the United States, weighed heavily on upstream valuation multiples. For integrated majors, softening commodity prices directly threaten upstream realization rates, prompting institutional desks to trim exposure to cyclical energy equities as near-term cash flow projections are adjusted downward.
Compounding the pressure from weaker crude prices is growing market skepticism regarding the sustainability of elevated refining margins. While downstream operations provided a substantial profit buffer in recent quarters due to tight fuel product balances, investors are increasingly anticipating margin normalization as global refining capacity catches up and product demand moderates. Additionally, sustained margin headwinds across the petrochemical segment continue to dilute the integrated defensive cushion, creating a less forgiving backdrop for the company when headline crude prices pull back.
The intraday decline also reflects capital allocation scrutiny and tactical profit taking following the stock's resilient multi-month performance. Although the company announced notable operational progress, including expanding offshore production capacity in Guyana and clearing key regulatory hurdles for large-scale liquefied natural gas developments abroad, these capital-intensive, long-cycle projects reinforce investor sensitivity to balance sheet commitments in a softer pricing regime. With energy market sentiment deteriorating amid macroeconomic growth concerns, institutional asset managers engaged in sector-wide de-risking, accelerating the stock's intraday retreat.
Technical Analysis of Exxon Mobil Corp (XOM)
Technically, Exxon Mobil Corp (XOM) shows a MACD (12,26,9) value of -2.552, indicating a sell signal. The RSI at 37.853 suggests neutral condition and the Williams %R at 90.982 suggests oversold condition. Please monitor closely.
Fundamental Analysis of Exxon Mobil Corp (XOM)
Exxon Mobil Corp (XOM) is in the Energy - Fossil Fuels industry. Its latest annual revenue is $323.90B, ranking 1 in the industry. The net profit is $28.84B, ranking 1 in the industry. Company Profile
Over the past month, multiple analysts have rated the company as Hold, with an average price target of $183.02, a high of $213.00, and a low of $142.00.
More details about Exxon Mobil Corp (XOM)
Company Specific Risks:
- Liquidity Drain from $3 Billion Debt Tender Offer: On November 16, 2026, ExxonMobil and subsidiary Pioneer Natural Resources launched cash tender offers to buy back up to $3.0 billion in outstanding senior notes. This creates an immediate multi-billion-dollar near-term cash commitment that competes with existing capital spending and heavy shareholder return programs.
- Post-Ex-Dividend Divestment and Yield Compression: Following the stock's ex-dividend date on November 16, 2026, shares have faced immediate post-distribution selling pressure. With the recent equity rally compressing the dividend yield to approximately 2.6%, the stock has experienced reduced demand from traditional income-focused institutional investors.
- Refining Margin Peak and Multi-Year Earnings Compression: Recent analyst updates highlight that outsized quarterly downstream earnings were driven by unsustainably elevated refining crack spreads. Institutional consensus now models normalized earnings per share to compress toward $10.32 over the forward cycle as fuel markets normalize, leaving the equity vulnerable to multiple compression.
- Middle East Export Bottlenecks and Geopolitical Premium Unwind: Intraday volatility reflects operational vulnerabilities in regional crude handling, where Middle Eastern transport disruptions and shipping bottlenecks continue to constrain regional output to approximately 550,000 barrels per day, leaving company realizations exposed to downside if regional risk premiums diminish.
This article may include AI-generated content that is human-reviewed, which is for reference and general information purposes only and does not constitute investment advice.
Recommended Articles









Comments (0)
Click the $ button, enter the symbol, and select to link a stock, ETF, or other ticker.