


 Discount


BHP Group Ltd Stock (BHP) Opened Down by 4.60% on Nov 18: Facts Behind the Movement


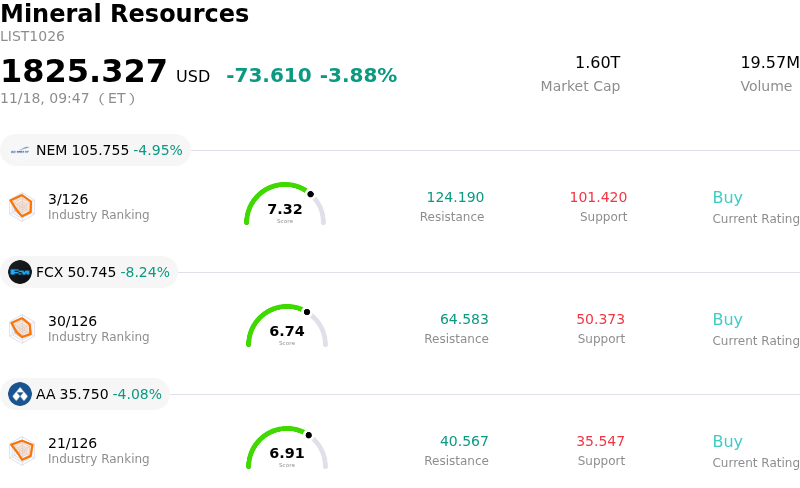
BHP Group Ltd (BHP) opened down by 4.60%. The Mineral Resources sector is down by 3.88%. The company underperformed the industry. Top 3 stocks by turnover in the sector: Newmont Corporation (NEM) down 4.95%; Freeport-McMoRan Inc (FCX) down 7.92%; Alcoa Corp (AA) down 3.73%.
What is driving BHP Group Ltd (BHP)’s stock price down today?
BHP Group experienced pronounced downward pressure during the session, driven primarily by weakness across key commodity benchmarks and broader macroeconomic headwinds facing the basic materials sector. As one of the world's largest diversified resource producers, BHP remains heavily exposed to swings in iron ore and copper prices. A softening in industrial demand expectations, particularly from major steelmaking hubs in Asia, triggered selling across the mining complex as steel mill margins contracted and portside stockpiles elevated.
Compounding the pressure on underlying commodity prices, broader currency dynamics played an active role in dampening sentiment. A strengthening U.S. dollar raised the effective cost of dollar-denominated raw materials for overseas consumers, accelerating risk-off behavior among global cyclical assets. Institutional investors responded by de-risking broad commodity allocations, shifting capital away from upstream extractors toward more defensive corners of the market.
From an industry and operational perspective, investor scrutiny has intensified over structural cost inflation and medium-term capital expenditure commitments. Market participants continue to weigh margin risks related to sustained labor, energy, and maintenance costs across major operating hubs in Australia and the Americas. Concurrently, substantial capital allocation directed toward long-cycle expansion initiatives, such as growth in copper and potash development, creates near-term free cash flow dilution without immediate production offsets.
Additionally, legal and regulatory overhangs continue to intermittently weigh on investor sentiment, notably ongoing resolution processes and potential liability adjustments surrounding legacy joint-venture operations. When combined with macroeconomic crosscurrents and softening physical market indicators, these factors prompted institutional portfolio managers to trim cyclical commodity exposures, leading to an accelerated intraday pullback in the shares.
Technical Analysis of BHP Group Ltd (BHP)
Technically, BHP Group Ltd (BHP) shows a MACD (12,26,9) value of -1.454, indicating a sell signal. The RSI at 28.830 suggests sell condition and the Williams %R at 99.381 suggests oversold condition. Please monitor closely.
Fundamental Analysis of BHP Group Ltd (BHP)
BHP Group Ltd (BHP) is in the Mineral Resources industry. Its latest annual revenue is $58.76B, ranking 2 in the industry. The net profit is $9.83B, ranking 2 in the industry. Company Profile
Over the past month, multiple analysts have rated the company as Hold, with an average price target of $77.25, a high of $96.00, and a low of $61.50.
More details about BHP Group Ltd (BHP)
Company Specific Risks:
- UK High Court Samarco Liability Verdict: The English High Court handed down a landmark ruling finding BHP liable under Brazilian law for the 2015 Fundão dam collapse in a £36 billion mass tort action involving more than 620,000 claimants, introducing massive balance sheet uncertainty and severe unprovisioned liability risks despite existing municipal settlements in Brazil.
- Copper Division Operational Disruptions: Intraday selling escalated following steep declines across copper benchmarks and persistent operational setbacks, including a 19% year-over-year drop in copper production caused by ore grade depletion, mechanical failures at Carrapateena, and operational suspensions following fatal accidents at Escondida, directly threatening a segment that accounts for over half of group EBITDA.
- Iron Ore Benchmark Compression and China Exposure: Benchmark seaborne iron ore prices fell below $92 per tonne due to persistent contractions in Chinese steel mill margins and real estate weakness, directly compressing operational margins and cash flow visibility across BHP's flagship Western Australia Iron Ore (WAIO) network.
- Analyst Downgrades and Peak Valuation De-Rating: Institutional brokerages have lowered BHP to Neutral ratings and trimmed forward earnings estimates, citing valuation compression risks as the stock trades at 1.1x to 1.2x price-to-net present value—the top of its historical cycle—leaving zero safety margin against escalating operational expenditures and capital outlays.
This article may include AI-generated content that is human-reviewed, which is for reference and general information purposes only and does not constitute investment advice.
Recommended Articles








Comments (0)
Click the $ button, enter the symbol, and select to link a stock, ETF, or other ticker.