


QXO Inc Stock (QXO) Closed Down by 7.24% on Nov 12: Facts Behind the Movement


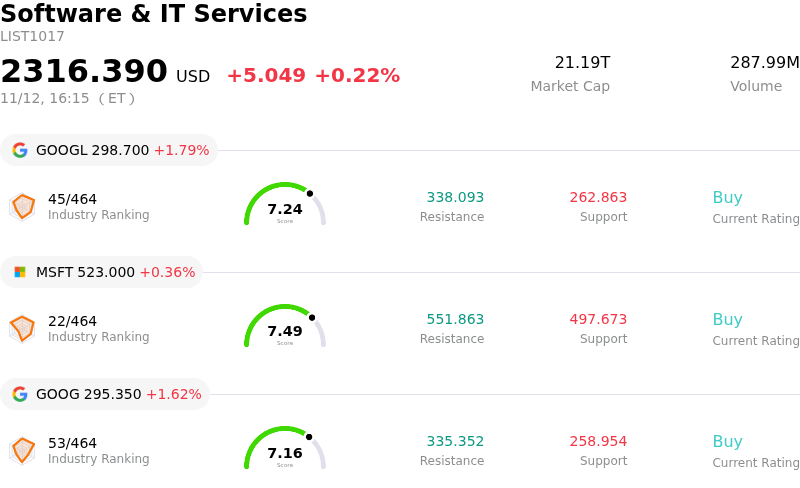
QXO Inc (QXO) closed down by 7.24%. The Software & IT Services sector is up by 0.22%. The company underperformed the industry. Top 3 stocks by turnover in the sector: Alphabet Inc Class A (GOOGL) up 1.79%; Microsoft Corp (MSFT) up 0.36%; Alphabet Inc Class C (GOOG) up 1.62%.
What is driving QXO Inc (QXO)’s stock price down today?
QXO experienced notable downward pressure as institutional investors locked in profits following a sharp multi-day rally earlier in the week. The preceding surge had been driven by stronger-than-expected preliminary third-quarter revenue figures and ambitious long-term operational targets. However, with the company scheduled to deliver its official, finalized quarterly report and conduct its formal conference call after the closing bell, market participants actively de-risked and trimmed extended long positions ahead of the release.
Underlying caution also resurfaced regarding the integration complexities and cost profile of the company's aggressive acquisition playbook. While recent large-scale buyouts have rapidly scaled overall revenue, preliminary disclosures continued to reflect ongoing net losses and significant transaction-related overhead. As institutional desks scrutinized these figures leading into the finalized print, questions regarding core organic sales momentum and margin expansion in a sluggish construction backdrop prompted defensive portfolio adjustments.
Market sentiment was further tempered by lingering governance and bandwidth considerations. Although executive leadership explicitly reaffirmed its commitment to running QXO and executing its multi-billion-dollar expansion plan, the recent announcement of a concurrent platform acquisition venture sparked subtle skepticism regarding potential division of strategic focus over the long run. Combined with broader cyclical headwinds across residential and commercial building supplies driven by restrictive financing conditions, these factors prompted a pronounced retreat as investors favored a wait-and-see approach.
Technical Analysis of QXO Inc (QXO)
Technically, QXO Inc (QXO) shows a MACD (12,26,9) value of 0.604, indicating a buy signal. The RSI at 56.334 suggests neutral condition and the Williams %R at 33.418 suggests buy condition. Please monitor closely.
Fundamental Analysis of QXO Inc (QXO)
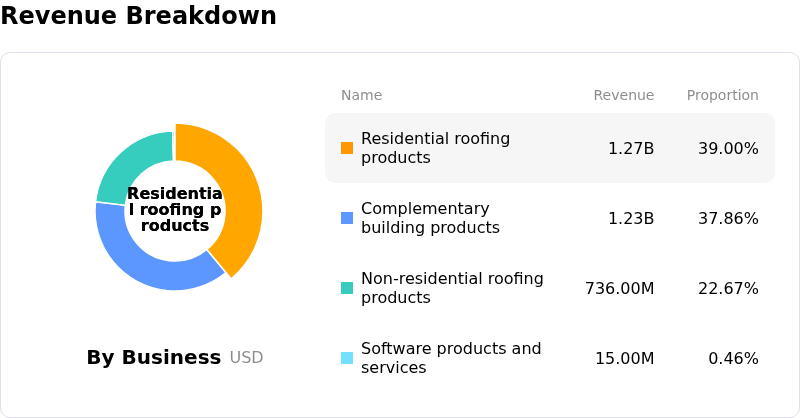
QXO Inc (QXO) is in the Software & IT Services industry. Its latest annual revenue is $6.84B, ranking 48 in the industry. The net profit is $-388.30M, ranking 584 in the industry. Company Profile
Over the past month, multiple analysts have rated the company as Buy, with an average price target of $25.35, a high of $50.00, and a low of $15.00.
More details about QXO Inc (QXO)
Company Specific Risks:
- Executive Leadership Transition and Management Distraction: An 8-K filing on November 12, 2026, confirmed an executive shift with Chief Financial Officer Ihsan Essaid being replaced by incoming CFO Dev Ahuja. This leadership change immediately follows CEO Brad Jacobs announcing an external $1 billion capital allocation into a separate public venture (CKX Lands), amplifying institutional concerns regarding executive capacity, strategic split of focus, and governance during a transformative scaling phase.
- High Leverage and Negative Cash Flow Generation: Recent preliminary disclosures and quarterly assessments highlight that QXO carries approximately $6.2 billion in debt following its debt-financed roll-up acquisitions of Beacon, Kodiak, and TopBuild. Coupled with negative free cash flow (-$248.1 million in recent results) and persistent GAAP net losses, elevated interest expenses constrain liquidity and elevate refinancing risks under sustained higher-for-longer borrowing rates.
- Complex Multi-Asset Integration and Downward Analyst Revisions: Sell-side firms, including Baird, Citi, and Wells Fargo, have slashed price targets due to mounting risks surrounding the concurrent integration of massive acquisitions. Consolidating multiple branch networks, legacy IT systems, and disparate operating structures has inflated corporate overhead, resulting in downward revisions to near-term EPS consensus and negative earnings surprise predictability.
- End-Market Demand Softness in Residential Building and Roofing: Fresh channel checks and commentary point to weakening residential roofing and complementary building product volumes, pressured by subdued housing starts and sluggish builder sentiment. Because QXO's lofty 2030 target of reaching up to $5.5 billion in EBITDA relies heavily on organic volume growth and pricing power, persistent end-market cyclical contraction poses a direct threat to guidance execution.
This article may include AI-generated content that is human-reviewed, which is for reference and general information purposes only and does not constitute investment advice.
Recommended Articles







Comments (0)
Click the $ button, enter the symbol, and select to link a stock, ETF, or other ticker.