


SanDisk Corporation Stock (SNDK) Moved Down by 4.12% on Nov 12: A Full Analysis


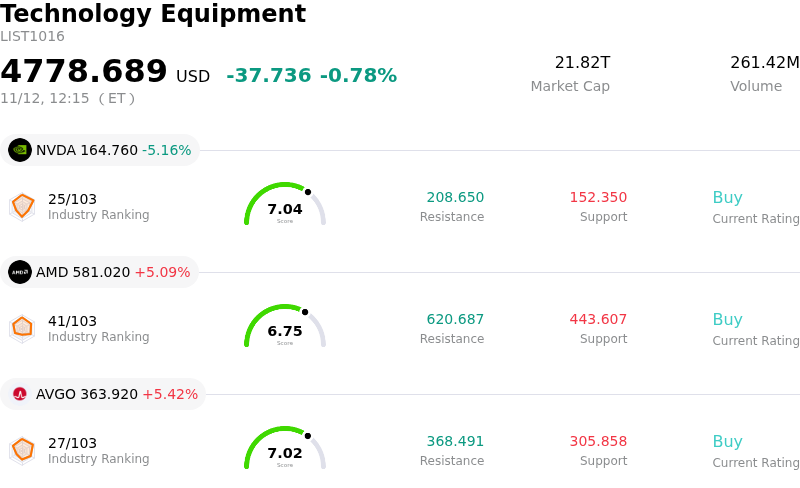
SanDisk Corporation (SNDK) moved down by 4.12%. The Technology Equipment sector is down by 0.78%. The company underperformed the industry. Top 3 stocks by turnover in the sector: NVIDIA Corp (NVDA) down 5.07%; Advanced Micro Devices Inc (AMD) up 5.28%; Broadcom Inc (AVGO) up 5.55%.
What is driving SanDisk Corporation (SNDK)’s stock price down today?
Sandisk experienced a notable pullback during intraday trading, primarily driven by aggressive profit-taking and mean reversion following a multi-session rally across AI infrastructure and memory names. After an extraordinary advance fueled by surging data center storage demand and optimism surrounding the NAND flash pricing cycle, short-term momentum traders and hedge funds moved to trim high-beta exposure. Given the equity's heightened volatility profile, the shares proved especially vulnerable to rapid intraday sentiment shifts as broader market risk appetite softened.
Beyond tactical liquidation, investor sentiment in the semiconductor memory segment has grown increasingly sensitive to the durability of the current upcycle. While recent operating updates and expanding multiyear customer commitments highlighted robust enterprise and cloud appetite, institutional participants continue to debate the trajectory of average selling prices and capacity discipline across the broader flash industry. With capital expenditure forecasts among major hyperscalers facing increased scrutiny, any perceived pause in the broader artificial intelligence hardware trade prompts immediate de-risking across cyclical component suppliers.
Broader macroeconomic pressures and options-driven hedging dynamics further amplified the downward momentum. Upward drift in bond yields and selective sector rotation away from high-multiple semiconductor leaders led institutional asset managers to reallocate capital toward more defensive assets. Concurrently, heightened activity in short-dated options contracts contributed to dealer-driven selling pressure via mechanical delta-hedging. In the near term, the stock is expected to remain range-bound and volatile as market participants digest recent gains and assess long-term data center storage tailwinds against medium-term cyclical valuation risks.
Technical Analysis of SanDisk Corporation (SNDK)
Technically, SanDisk Corporation (SNDK) shows a MACD (12,26,9) value of -28.199, indicating a sell signal. The RSI at 35.962 suggests neutral condition and the Williams %R at 77.549 suggests sell condition. Please monitor closely.
Media Coverage of SanDisk Corporation (SNDK)
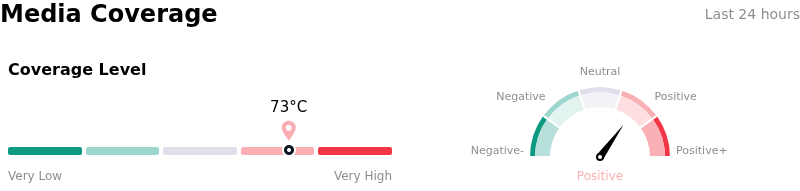
In terms of media coverage, SanDisk Corporation (SNDK) shows a coverage score of 73, indicating a high level of media attention. The overall market sentiment index is currently in bullish zone.
Fundamental Analysis of SanDisk Corporation (SNDK)
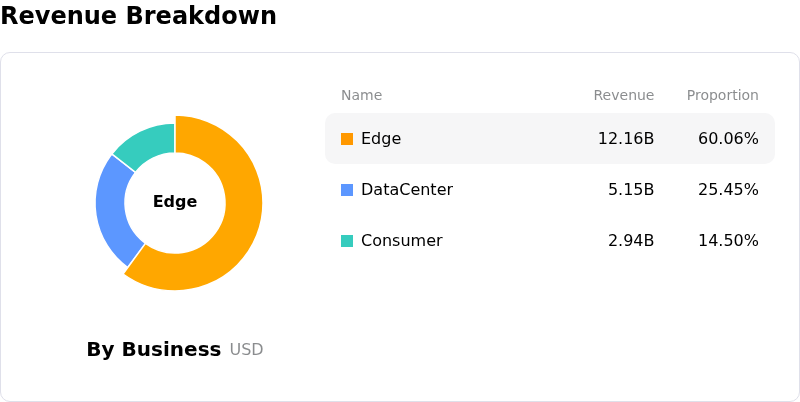
SanDisk Corporation (SNDK) is in the Technology Equipment industry. Its latest annual revenue is $20.25B, ranking 8 in the industry. The net profit is $11.43B, ranking 2 in the industry. Company Profile
Over the past month, multiple analysts have rated the company as Buy, with an average price target of $2024.13, a high of $3000.00, and a low of $1020.00.
More details about SanDisk Corporation (SNDK)
Company Specific Risks:
- Accounts Receivable Acceleration and Cash Conversion Strain: Scrutiny over recent financial disclosures highlights that accounts receivable expanded 452.0% year-over-year, materially outpacing revenue growth of 377.9%, signaling mounting customer payment deferrals and working capital strain that threaten reported cash flow conversion amid aggressive $5.0 billion capital outlays for share buybacks.
- Severe Demand Contraction in Non-Enterprise Segments: A sharp 29% sequential collapse in consumer flash and client device sales underscores severe top-line vulnerability, proving that rapid NAND price increases are actively causing demand destruction across retail and mobile end markets and leaving the company excessively dependent on concentrated data center budgets.
- Depressed Valuation Multiples Reflecting Peak-Cycle Skepticism: SanDisk trades at a persistent valuation discount of roughly 6x to 7x forward earnings compared to memory peers, reflecting institutional consensus that 85.1% gross margins have reached cyclical peaks and remain highly vulnerable to margin degradation from competing Asian NAND capacity ramp-ups.
- Overhead Technical Failure and Pre-Split Derivative Volatility: Intraday price action shows swift exhaustion and downside pressure as shares fail to break critical Fibonacci resistance at $1,011, exposing the stock to aggressive selling toward recent $803 support levels amid heavy options positioning and hedging adjustments leading up to the November 19 eight-for-one stock split.
This article may include AI-generated content that is human-reviewed, which is for reference and general information purposes only and does not constitute investment advice.
Recommended Articles







Comments (0)
Click the $ button, enter the symbol, and select to link a stock, ETF, or other ticker.