


Newmont Corporation Stock (NEM) Moved Down by 3.27% on Nov 12: Drivers Behind the Movement


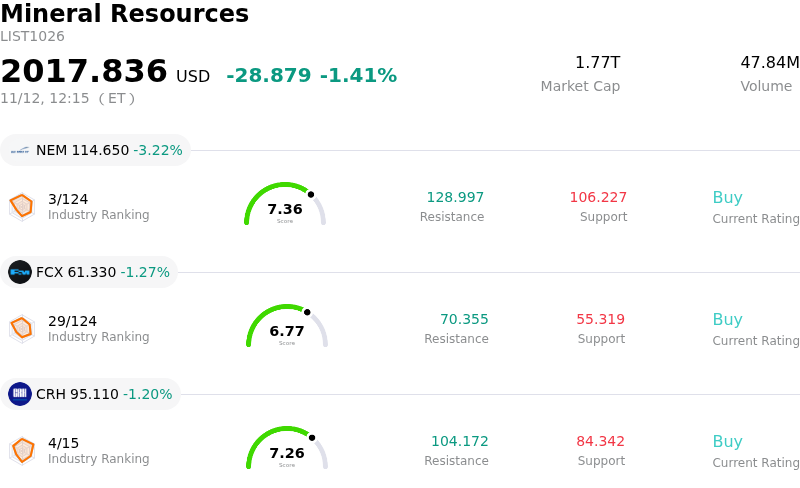
Newmont Corporation (NEM) moved down by 3.27%. The Mineral Resources sector is down by 1.41%. The company underperformed the industry. Top 3 stocks by turnover in the sector: Newmont Corporation (NEM) down 3.22%; Freeport-McMoRan Inc (FCX) down 1.19%; CRH PLC (CRH) down 1.20%.
What is driving Newmont Corporation (NEM)’s stock price down today?
Newmont Corporation experienced noticeable downward pressure as a confluence of macroeconomic headwinds, bullion price weakness, and lingering operational cost sensitivities weighed heavily on investor sentiment. As the worlds largest gold producer, Newmonts equity performance remains fundamentally levered to underlying commodity benchmarks. A firming U.S. dollar and elevated Treasury yields created strong headwinds for non-yielding precious metals, prompting broad-based liquidations across gold futures and leading to institutional de-risking within the gold mining space.
Beyond macroeconomic and currency factors, market participants continue to scrutinize the mining sectors underlying operational economics. Gold producers face persistent structural inflation across key input costs, including mining labor, diesel, and maintenance materials. For Newmont, ongoing integration initiatives and capital deployment related to its multi-asset portfolio keep all-in sustaining costs at the center of institutional evaluations. When commodity prices soften even moderately, margins compress rapidly due to operational leverage, driving equity valuations down more sharply than the physical metal itself.
Portfolio adjustments and sector-wide sentiment have amplified this volatility. Precious metals equities often see heightened beta during trading sessions characterized by shifting expectations for central bank monetary policy. As traders repositioned around macroeconomic data, algorithmic flows and automated hedging by exchange-traded funds tracking gold miners accelerated the sell-off. The broader materials sector experienced a rotation away from defensive and hedging assets, putting additional technical pressure on Newmont as institutional desks adjusted tactical hedges.
Looking ahead, Newmonts near-term trajectory will depend largely on stabilization in physical bullion markets and the companys execution regarding asset optimization and cost containment. While its tier-one asset base and disciplined capital return framework provide robust long-term insulation, the current environment underscores the heightened operational leverage inherent in large-cap gold miners during periods of macroeconomic repricing.
Technical Analysis of Newmont Corporation (NEM)
Technically, Newmont Corporation (NEM) shows a MACD (12,26,9) value of 1.566, indicating a neutral signal. The RSI at 47.827 suggests neutral condition and the Williams %R at 55.643 suggests sell condition. Please monitor closely.
Media Coverage of Newmont Corporation (NEM)
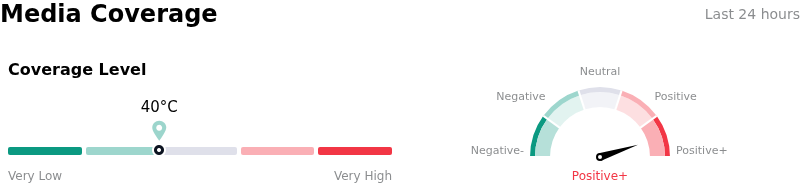
In terms of media coverage, Newmont Corporation (NEM) shows a coverage score of 40, indicating a low level of media attention. The overall market sentiment index is currently in extremely bullish zone.
Fundamental Analysis of Newmont Corporation (NEM)
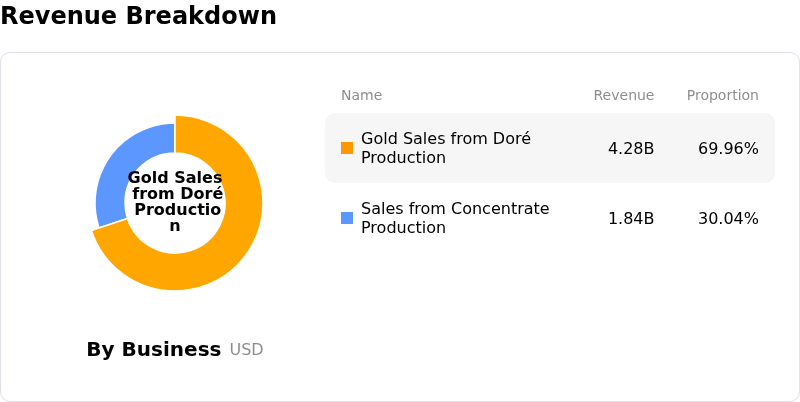
Newmont Corporation (NEM) is in the Mineral Resources industry. Its latest annual revenue is $22.67B, ranking 10 in the industry. The net profit is $7.08B, ranking 3 in the industry. Company Profile
Over the past month, multiple analysts have rated the company as Buy, with an average price target of $139.25, a high of $205.00, and a low of $79.00.
More details about Newmont Corporation (NEM)
Company Specific Risks:
- Projected Fourth-Quarter AISC Cost Spike: Management forecasts indicate All-In Sustaining Costs (AISC) will jump to approximately $1,900 per ounce in the fourth quarter, up sharply from $1,454 per ounce in the third quarter, driven by concentrated sustaining capital expenditures and input inflation that threaten significant near-term margin compression.
- Substantial Fourth-Quarter JV Cash Outflow: Under an amended agreement for the Nevada Gold Mines joint venture, Newmont faces an imminent $1.95 billion cash payment to Barrick Gold in the fourth quarter, imposing heavy near-term liquidity demands amidst a softening commodity pricing environment.
- Byproduct Volume Declines and Operational Drag: Expected production contraction, including an estimated 30% decline in silver output at Peñasquito alongside operational headwinds across Lihir and Australian assets, is diminishing crucial co-product credits that typically offset gold extraction costs.
- Escalating Development CapEx and Extended Payback Timelines: Institutional analysts cite concern over a projected ~$500 million increase in 2027 development capital expenditures, led by deep capital commitments such as the $4.2 billion to $4.8 billion Red Chris Block Cave project, which defers cash-flow returns well into the next decade.
This article may include AI-generated content that is human-reviewed, which is for reference and general information purposes only and does not constitute investment advice.
Recommended Articles









Comments (0)
Click the $ button, enter the symbol, and select to link a stock, ETF, or other ticker.