


Barrick Mining Ord Shs Stock (B) Moved Down by 5.23% on Nov 10: What Investors Need To Know


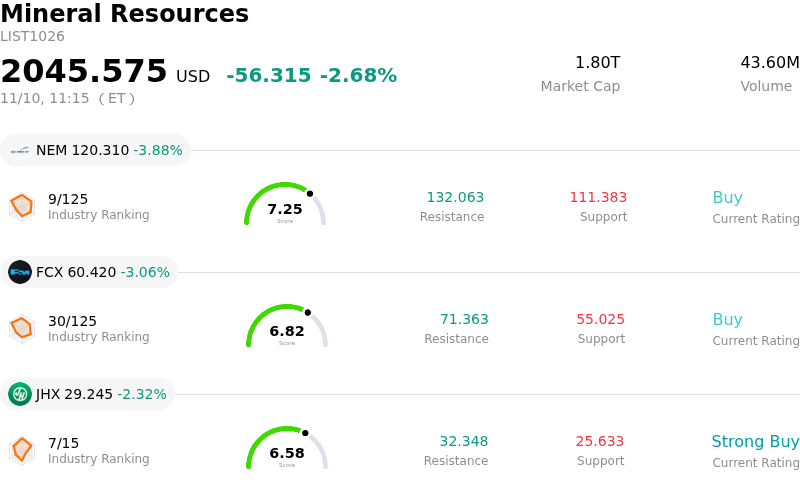
Barrick Mining Ord Shs (B) moved down by 5.23%. The Mineral Resources sector is down by 2.68%. The company underperformed the industry. Top 3 stocks by turnover in the sector: Newmont Corporation (NEM) down 4.08%; Freeport-McMoRan Inc (FCX) down 3.37%; James Hardie Industries PLC (JHX) down 2.32%.
What is driving Barrick Mining Ord Shs (B)’s stock price down today?
Barrick Mining Corporation experienced pronounced downward pressure as market participants recalibrated expectations following the release of its third-quarter financial results. Although the company initially saw support from an adjusted earnings per share beat, sentiment rapidly shifted toward profit-taking. Headline revenue fell short of consensus projections, triggering a classic sell-the-news reaction among institutional investors after recent share price appreciation.
Operational cost pressures served as a central catalyst behind the retreat. The company reported a sharp year-over-year escalation in gold all-in sustaining costs, heavily influenced by lower ore grades, elevated diesel expenses, and increased royalty burdens tied to high realized metal prices. Operational friction, including severe weather disruptions at the Veladero asset and temporary bottlenecks accessing higher-grade material at North Mara, highlighted persistent margin headwinds despite a historically favorable commodity price environment.
Compounding the margin concerns, updates on strategic initiatives introduced fresh uncertainty. Management trimmed full-year capital expenditure guidance primarily due to an ongoing review of the large-scale Reko Diq project, raising questions regarding the pace of long-term development spending. Concurrently, persistent jurisdictional exposures in West Africa, marked by retroactive mining code adjustments and associated levies, continued to inject geopolitical risk into the equity narrative. While the proposed spin-off and initial public offering of its North American assets remains a key valuation catalyst, management commentary signaling that the transaction timeline could drift into the subsequent year tempered immediate speculative interest.
Broader macro dynamics also weighed on trading activity, as fluctuations in underlying bullion and copper spot prices pressured the wider mining complex. Even with ongoing balance sheet strength and reaffirmed commitments to shareholder distributions via base dividends and active share repurchases, investors prioritized near-term cost inflation and project execution risks, driving sharp intraday distribution across the stock.
Technical Analysis of Barrick Mining Ord Shs (B)
Technically, Barrick Mining Ord Shs (B) shows a MACD (12,26,9) value of 0.742, indicating a neutral signal. The RSI at 50.183 suggests neutral condition and the Williams %R at 42.413 suggests buy condition. Please monitor closely.
Fundamental Analysis of Barrick Mining Ord Shs (B)
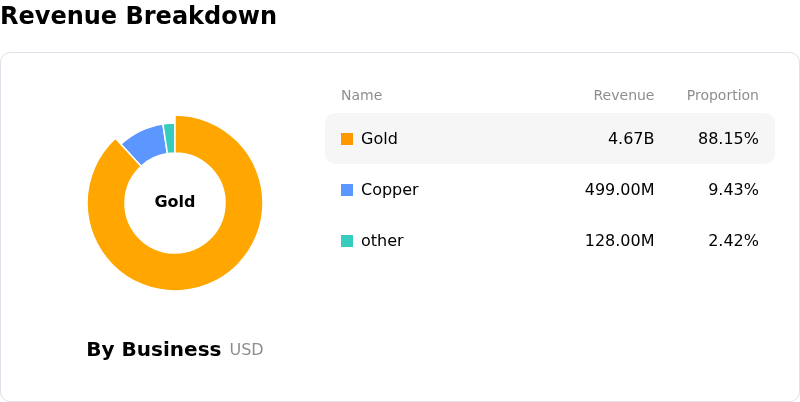
Barrick Mining Ord Shs (B) is in the Mineral Resources industry. Its latest annual revenue is $16.96B, ranking 13 in the industry. The net profit is $4.99B, ranking 4 in the industry. Company Profile
Over the past month, multiple analysts have rated the company as Buy, with an average price target of $50.31, a high of $58.00, and a low of $32.38.
More details about Barrick Mining Ord Shs (B)
Company Specific Risks:
- Cash Flow Compression and Revenue Miss: In its third-quarter 2026 financial report, Barrick reported revenue of $5.07 billion, falling short of Wall Street consensus estimates of $5.13 billion, while consolidated free cash flow contracted by 21% year-over-year to $1.17 billion, missing institutional analyst projections of $1.29 billion due to escalating capital expenditures and operational cash drains.
- Surging Unit Cost Inflation and Copper AISC Overruns: Gold all-in sustaining costs (AISC) escalated 24% year-over-year to $1,911 per ounce—approaching the ceiling of full-year guidance—while copper AISC spiked to $4.52 per pound, significantly worse than the $3.66 consensus forecast; management subsequently issued warnings that full-year copper cost measures are on track to meet or exceed the upper limit of the $3.45–$3.75 per pound guidance range due to diesel price shocks and foreign exchange headwinds.
- Operational Bottlenecks and Regional Output Declines: Third-quarter attributable gold production decreased 2% year-over-year to 816,000 ounces while copper output dropped sequentially to 50,000 tonnes, hindered by extreme weather disruptions causing 17 days of operational downtime at the Veladero mine in Argentina, persistent power and weather drag at Porgera, and delayed access to high-grade ore benches at North Mara.
- Fourmile Feasibility Delays and Carve-Out IPO Execution Uncertainty: Management disclosed on its earnings call that the pre-feasibility study for the flagship Fourmile deposit in Nevada faces project schedule slippage as underground access routes via the Goldrush decline are redesigned following joint-venture terms with Newmont, while the planned North American gold assets IPO remains exposed to regulatory review friction that threatens to push transaction completion into 2027.
This article may include AI-generated content that is human-reviewed, which is for reference and general information purposes only and does not constitute investment advice.
Recommended Articles







Comments (0)
Click the $ button, enter the symbol, and select to link a stock, ETF, or other ticker.