


SanDisk Corporation Stock (SNDK) Moved Down by 3.59% on Nov 10: Drivers Behind the Movement


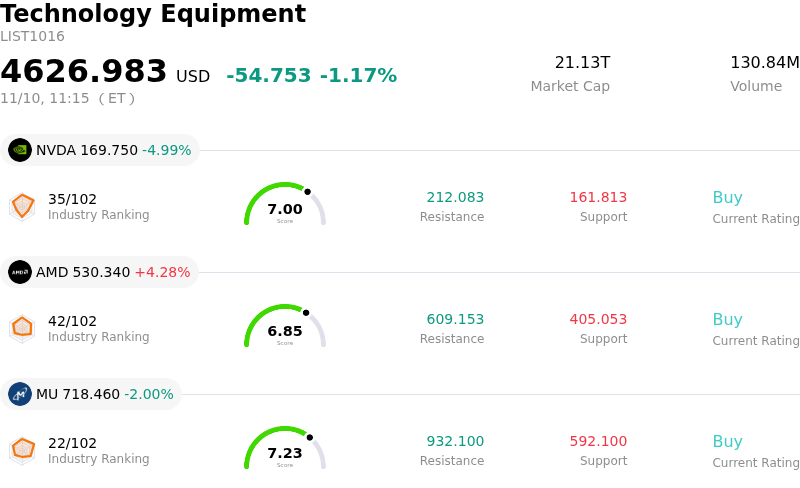
SanDisk Corporation (SNDK) moved down by 3.59%. The Technology Equipment sector is down by 1.17%. The company underperformed the industry. Top 3 stocks by turnover in the sector: NVIDIA Corp (NVDA) down 5.19%; Advanced Micro Devices Inc (AMD) up 3.89%; Micron Technology Inc (MU) down 2.33%.
What is driving SanDisk Corporation (SNDK)’s stock price down today?
The downward pressure on SNDK during today's trading session reflects renewed headwinds across the broader memory and storage hardware complex. Investors are reacting to indications of softening spot and contract pricing within the NAND flash market, driven by normalized customer inventory levels across enterprise and client device segments. Following an extended period of aggressive restocking, original equipment manufacturers appear to be pacing procurement cycles more conservatively, prompting near-term margin caution across institutional trading desks.
From a fundamental perspective, market participants are reassessing the cadence of near-term enterprise and hyperscale data center capital expenditures. While long-term structural demand supported by artificial intelligence workloads remains intact, current order books indicate a temporary digestion phase for high-density enterprise solid-state storage. Concurrently, competitive pricing actions from tier-one peers aiming to protect volume share have amplified sensitivity around quarterly gross margins, partially overshadowing ongoing cost-discipline initiatives.
The sell-off has been further compounded by broader macroeconomic dynamics, as firming benchmark yields and a general risk-off sentiment across cyclical technology equities prompted systematic factor-based selling. Institutional positioning indicates tactical rotation away from capital-intensive storage plays toward lower-beta defensive assets. Until clear visibility emerges regarding contract price stabilization and accelerated end-market demand recovery, SNDK is likely to remain exposed to industry-wide volatility and valuation multiple compression.
Technical Analysis of SanDisk Corporation (SNDK)
Technically, SanDisk Corporation (SNDK) shows a MACD (12,26,9) value of -72.139, indicating a sell signal. The RSI at 29.023 suggests sell condition and the Williams %R at 91.621 suggests oversold condition. Please monitor closely.
Media Coverage of SanDisk Corporation (SNDK)
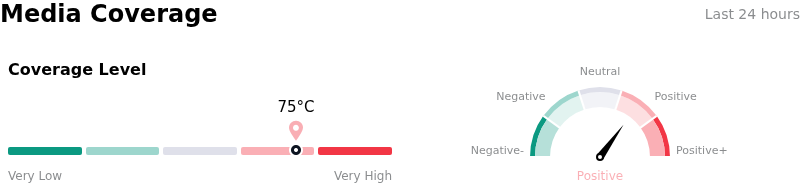
In terms of media coverage, SanDisk Corporation (SNDK) shows a coverage score of 75, indicating a high level of media attention. The overall market sentiment index is currently in bullish zone.
Fundamental Analysis of SanDisk Corporation (SNDK)
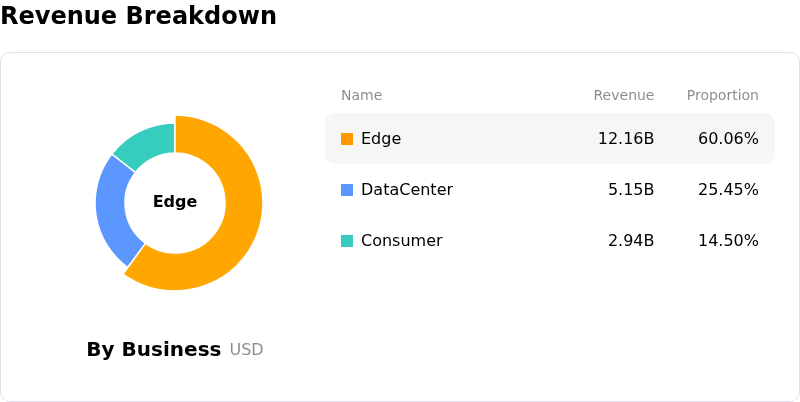
SanDisk Corporation (SNDK) is in the Technology Equipment industry. Its latest annual revenue is $20.25B, ranking 8 in the industry. The net profit is $11.43B, ranking 2 in the industry. Company Profile
Over the past month, multiple analysts have rated the company as Buy, with an average price target of $2024.13, a high of $3000.00, and a low of $1020.00.
More details about SanDisk Corporation (SNDK)
Company Specific Risks:
- NAND Flash Pricing Plateau and Margin Deceleration: Following manufacturing partner Kioxia’s recent disclosures of sharply decelerating NAND price increases and flat pricing outlooks, institutional analysts (including downgrades from Fox Advisors and target cuts from Morningstar and Wells Fargo) warned that Sandisk’s record ~85% gross margins have peaked, signaling a shift toward slower, volume-dependent growth and severe future downcycle risk.
- Market Share Contraction Amid Expanding Chinese Supply: Fresh industry data from Counterpoint Research indicates Sandisk's global NAND flash revenue share dropped from 13% to 11%, facing rapid displacement from state-backed Chinese competitors such as YMTC (rising to 14%) and CXMT, which are aggressively expanding production capacity and threatening long-term pricing power.
- Severe Demand Destruction Across Non-AI Consumer Segments: A sharp 29% sequential revenue contraction in Sandisk's Consumer segment underscores mounting demand destruction among price-sensitive end markets due to elevated NAND average selling prices, creating extreme revenue concentration and dependency on hyperscale data-center capex.
- Balance Sheet Red Flags and Collection Risk: Recent SEC Form 10-Q disclosures reveal that accounts receivable expanded by 452.0% year-over-year, significantly outstripping top-line revenue growth of 377.9%, signaling extended payment terms, working-capital stress, and heightened credit risk as post-midterm policy uncertainty clouds data-center infrastructure deployment.
This article may include AI-generated content that is human-reviewed, which is for reference and general information purposes only and does not constitute investment advice.
Recommended Articles






Comments (0)
Click the $ button, enter the symbol, and select to link a stock, ETF, or other ticker.