


Interactive Brokers Group Inc Stock (IBKR) Moved Up by 4.58% on Nov 6: A Full Analysis


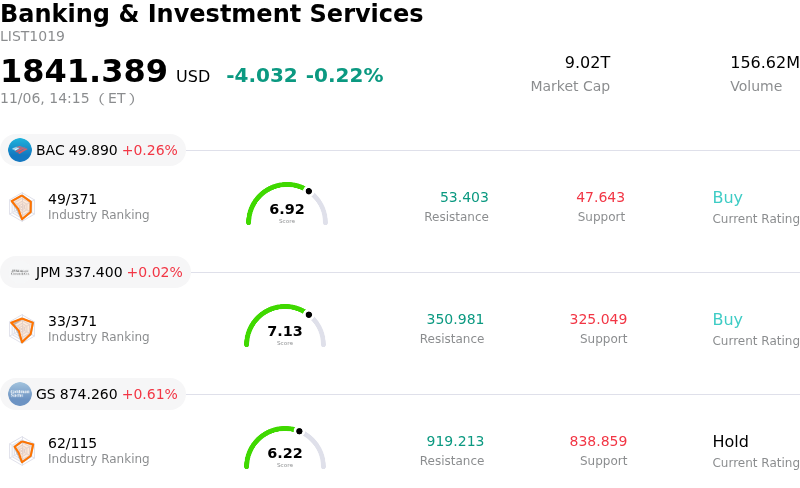
Interactive Brokers Group Inc (IBKR) moved up by 4.58%. The Banking & Investment Services sector is down by 0.22%. The company outperformed the industry. Top 3 stocks by turnover in the sector: Bank of America Corp (BAC) up 0.28%; JPMorgan Chase & Co (JPM) up 0.02%; Goldman Sachs Group Inc (GS) up 0.61%.
What is driving Interactive Brokers Group Inc (IBKR)’s stock price up today?
Shares of Interactive Brokers advanced firmly as investors responded favorably to robust underlying customer growth and a sequential rebound in trading activity highlighted in the brokerage's latest monthly performance metrics. Market participants welcomed the month-over-month increase in Daily Average Revenue Trades, which signaled that client engagement and trading volumes are regaining traction following prior periods of consolidation.
Underpinning the upward momentum is the company's sustained compounding of its core asset base. Interactive Brokers delivered substantial year-over-year expansion in total client accounts and ending client equity, demonstrating the global competitive advantage of its low-cost, multi-asset execution platform. Crucially for institutional investors assessing the revenue mix, client margin loan balances and credit balances registered sharp year-over-year gains. This accumulation of interest-earning assets offers a valuable counterweight to shifting monetary policy dynamics, reinforcing confidence that net interest income can remain resilient even amid broader interest rate adjustments.
Investor sentiment was further supported by technological platform enhancements and shareholder-friendly capital allocation. The introduction of expanded automation and artificial intelligence execution capabilities across tens of thousands of global securities has strengthened the firm's value proposition for both institutional and active retail traders. In parallel, recent capital management decisions, including a sizable increase in the quarterly dividend, provided a clear signal of balance sheet strength, elevated operating margins, and healthy cash flow visibility.
With Wall Street consensus forecasts maintaining an upbeat outlook on multi-year earnings expansion, the stock's advance reflects renewed institutional accumulation anchored in accelerating account acquisition, scalable operational leverage, and durable interest-earning power.
Technical Analysis of Interactive Brokers Group Inc (IBKR)
Technically, Interactive Brokers Group Inc (IBKR) shows a MACD (12,26,9) value of -1.058, indicating a sell signal. The RSI at 39.750 suggests neutral condition and the Williams %R at 69.580 suggests sell condition. Please monitor closely.
Fundamental Analysis of Interactive Brokers Group Inc (IBKR)
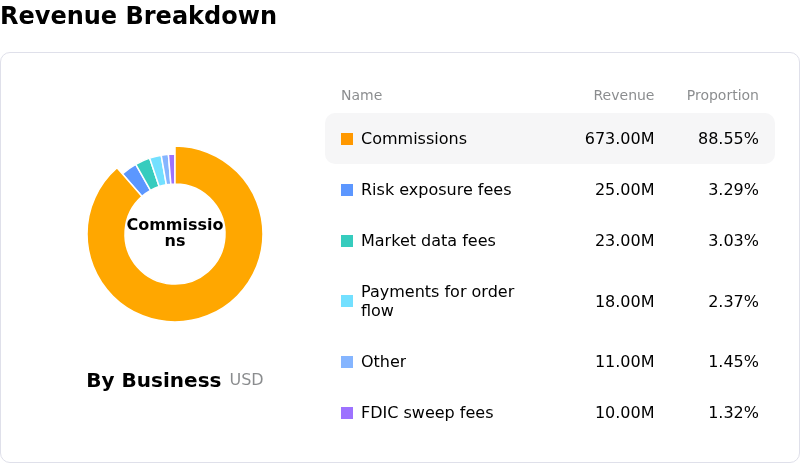
Interactive Brokers Group Inc (IBKR) is in the Banking & Investment Services industry. Its latest annual revenue is $10.00B, ranking 24 in the industry. The net profit is $984.00M, ranking 24 in the industry. Company Profile
Over the past month, multiple analysts have rated the company as Buy, with an average price target of $103.74, a high of $120.00, and a low of $73.19.
More details about Interactive Brokers Group Inc (IBKR)
Company Specific Risks:
- Year-over-Year Contraction in Trading Velocity: Freshly reported monthly brokerage metrics show client Daily Average Revenue Trades (DARTs) dropped 4% year-over-year to 4.306 million, corroborating recent quarterly data where trades per account declined 19% and signaling diminishing trading engagement across the platform despite headline account additions.
- Net Interest Income Sensitivity to Monetary Easing: Because net interest income accounts for approximately two-thirds of top-line net revenue ($1.15 billion), the company is acutely exposed to margin compression and revenue headwinds as central banks cut interest rates, reducing yield spreads on segregated cash balances and margin lending.
- Pretax Margin Compression and Multiple Vulnerability: Recent analyst commentary highlighted that adjusted pretax margins have eroded from historic highs down to 71.5%, leaving the stock vulnerable to valuation re-ratings given its forward price-to-earnings multiple of over 22x, which commands a substantial premium over the financial brokerage sector average.
- Insider Liquidation and Elevated Bearish Options Positioning: SEC Form 4 filings detailing multi-million-dollar insider share sales, combined with heavy institutional block purchases of out-of-the-money put contracts, reflect institutional hedging and downside momentum following an extended multi-week share price slump.
This article may include AI-generated content that is human-reviewed, which is for reference and general information purposes only and does not constitute investment advice.
Recommended Articles










Comments (0)
Click the $ button, enter the symbol, and select to link a stock, ETF, or other ticker.