


Morgan Stanley Stock (MS) Moved Down by 6.26% on Nov 5: Key Drivers Unveiled


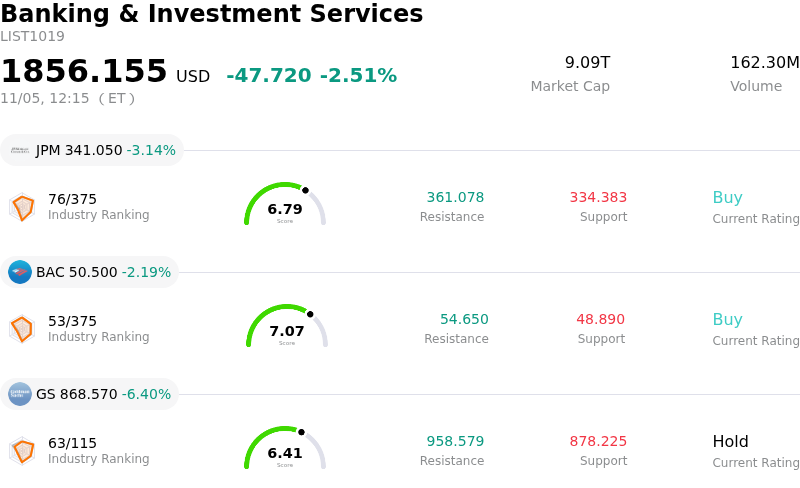
Morgan Stanley (MS) moved down by 6.26%. The Banking & Investment Services sector is down by 2.51%. The company underperformed the industry. Top 3 stocks by turnover in the sector: JPMorgan Chase & Co (JPM) down 3.07%; Bank of America Corp (BAC) down 2.19%; Goldman Sachs Group Inc (GS) down 6.40%.
What is driving Morgan Stanley (MS)’s stock price down today?
Morgan Stanley faced sharp downward pressure during the session as a confluence of macroeconomic crosscurrents, capital markets uncertainty, and sector-wide profit-taking weighed on large-cap financial institutions. A shift in broader market sentiment, driven by evolving interest rate expectations and volatility across the fixed-income complex, prompted institutional investors to recalibrate their exposure to diversified financials. As benchmark yields adjusted and risk-off sentiment permeated broader equities, high-beta investment banks and wealth managers experienced accelerated selling, reflecting heightened sensitivity to broader macroeconomic growth trajectories.
From a fundamental and operational perspective, investor attention centered on the pace of capital markets recovery and the sustainability of fee-based revenue streams. Wealth Management, which represents a core pillar of the firm's valuation and steady-state earnings, remains exposed to asset-sensitive revenue dynamics, including deposit pricing behavior, cash sweep yield headwinds, and the pace of net new asset accumulation. Concurrently, within the Institutional Securities franchise, expectations regarding the timing and conversion of investment banking pipelines have encountered renewed scrutiny. Delays in debt and equity underwriting activity, coupled with persistent hesitancy in global merger and acquisition closings, have led to more cautious modeling for advisory fee realizations in the near term.
Trading operations also contributed to market unease, as elevated market uncertainty often forces institutional clients to adopt defensive posturing rather than active portfolio repositioning. Normalization in fixed income, currency, and commodities trading, alongside equity derivatives volumes, creates difficult year-over-year comparables that amplify downside revisions from sell-side analysts. Furthermore, any broader equity market decline exerts direct downward pressure on fee-generating client assets under management, which automatically compresses future asset management fee margins.
Institutional portfolio repositioning and broader risk-off behavior exacerbated the pullback. Systematic funds and large asset managers frequently trim cyclical financial allocations during periods of rising volatility, reallocating capital into defensive sectors or cash equivalents. When combined with ongoing regulatory vigilance concerning capital adequacy, liquidity buffers, and wealth compliance frameworks, these structural and macro factors triggered a broad-based retrenchment in the stock, underscoring near-term investor caution regarding the velocity of operating leverage across the franchise.
Technical Analysis of Morgan Stanley (MS)
Technically, Morgan Stanley (MS) shows a MACD (12,26,9) value of 2.311, indicating a neutral signal. The RSI at 43.035 suggests neutral condition and the Williams %R at 69.180 suggests sell condition. Please monitor closely.
Media Coverage of Morgan Stanley (MS)
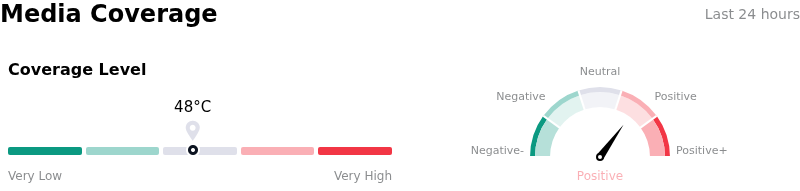
In terms of media coverage, Morgan Stanley (MS) shows a coverage score of 48, indicating a moderate level of media attention. The overall market sentiment index is currently in bullish zone.
Fundamental Analysis of Morgan Stanley (MS)
Morgan Stanley (MS) is in the Banking & Investment Services industry. Its latest annual revenue is $114.74B, ranking 3 in the industry. The net profit is $16.25B, ranking 2 in the industry. Company Profile
Over the past month, multiple analysts have rated the company as Buy, with an average price target of $214.10, a high of $262.00, and a low of $190.00.
More details about Morgan Stanley (MS)
Company Specific Risks:
- Wealth Management Cash Sweep Margin Compression: Net interest income within the Wealth Management division faces sequential margin erosion to $2.23 billion as average deposit costs escalated from 2.60% to 2.85%, driven by intensifying client payout demands that degrade the profitability of core cash sweep balances.
- Investment Management Carried Interest Reversals and Outflows: The Investment Management segment recorded an 11.6% revenue drop to $1.46 billion, triggered by a $106 million reversal of previously accrued carried interest in private funds alongside $9.4 billion in net client outflows from equity strategies.
- Strategic Shareholder Liquidation Overhang: SEC Form 4 disclosures revealed that 10% owner Mitsubishi UFJ Financial Group disposed of 604,396 common shares under a Rule 10b5-1 plan, reinforcing downside pressure and supply overhang from major institutional stakeholders.
- Heightened Valuation Vulnerability to Equity Trading Downside: Options market pricing indicates 30-day implied volatility elevated to 31.6% (in the 64th percentile), reflecting institutional concern that institutional securities trading revenues and corporate advisory pipelines are exposed to broad market corrections and slowing deal completions.
This article may include AI-generated content that is human-reviewed, which is for reference and general information purposes only and does not constitute investment advice.
Recommended Articles








Comments (0)
Click the $ button, enter the symbol, and select to link a stock, ETF, or other ticker.