


Amazon.com Inc Stock (AMZN) Moved Down by 3.18% on Nov 5: What Signal Does It Send?


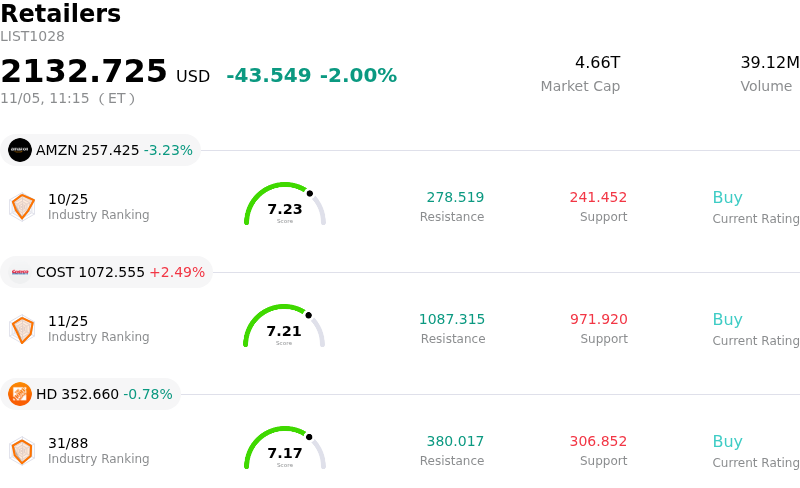
Amazon.com Inc (AMZN) moved down by 3.18%. The Retailers sector is down by 2.00%. The company underperformed the industry. Top 3 stocks by turnover in the sector: Amazon.com Inc (AMZN) down 3.18%; Costco Wholesale Corp (COST) up 2.49%; Home Depot Inc (HD) down 0.78%.
What is driving Amazon.com Inc (AMZN)’s stock price down today?
Amazon shares faced downward pressure during today's session as broad-based risk aversion across mega-cap technology coupled with renewed scrutiny over enterprise cloud and retail operating margins weighed on sentiment. A firming macroeconomic backdrop characterized by elevated Treasury yields and persistent concerns regarding monetary policy duration sparked a rotation away from high-multiple consumer discretionary and technology bellwethers, leading to notable intraday selling pressure across the peer group.
A primary fundamental headwind centers on the elevated capital expenditure trajectory required to sustain artificial intelligence infrastructure buildouts within Amazon Web Services. Institutional investors are increasingly scrutinizing the timing and scale of returns on these substantial investments. While top-line growth across cloud infrastructure remains structurally sound, market participants are weighing near-term margin dilution against long-term monetization milestones, particularly as enterprise IT spending environments remain selective and competition among hyperscalers intensifies.
Concurrently, the core e-commerce and retail operations face persistent headwinds from shifting consumer behavior. Discretionary spending trends have shown signs of moderation, prompting Amazon to rely more heavily on promotional activity and everyday essential categories, which inherently carry lower margin profiles. Although improvements in regional fulfillment efficiency have historically provided margin relief, fluctuations in transport and labor costs continue to test incremental profitability across both domestic and international segments.
From an institutional positioning perspective, the pullback reflects disciplined risk management and tactical de-risking by asset managers. Following periods of valuation expansion across large-cap technology, institutional portfolios have actively trimmed exposures to high-beta platforms during broader equity market weakness. Looking forward, institutional allocators will closely monitor enterprise contract commitments within cloud infrastructure, free cash flow durability amid capital expenditures, and high-margin advertising momentum as essential catalysts for price stabilization.
Technical Analysis of Amazon.com Inc (AMZN)
Technically, Amazon.com Inc (AMZN) shows a MACD (12,26,9) value of 1.330, indicating a neutral signal. The RSI at 53.050 suggests neutral condition and the Williams %R at 32.877 suggests buy condition. Please monitor closely.
Media Coverage of Amazon.com Inc (AMZN)
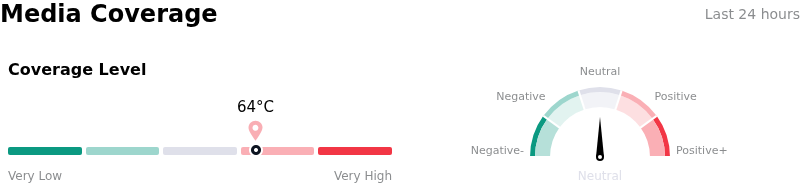
In terms of media coverage, Amazon.com Inc (AMZN) shows a coverage score of 64, indicating a high level of media attention. The overall market sentiment index is currently in neutral zone.
Fundamental Analysis of Amazon.com Inc (AMZN)
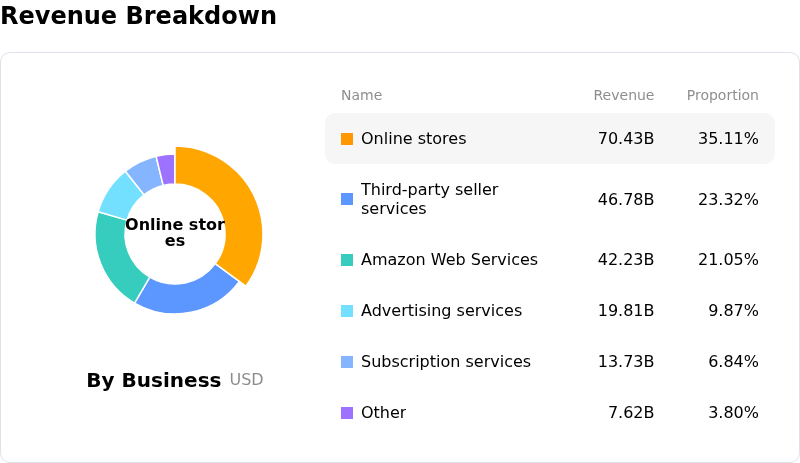
Amazon.com Inc (AMZN) is in the Retailers industry. Its latest annual revenue is $716.92B, ranking 1 in the industry. The net profit is $77.67B, ranking 1 in the industry. Company Profile
Over the past month, multiple analysts have rated the company as Buy, with an average price target of $323.05, a high of $405.00, and a low of $207.00.
More details about Amazon.com Inc (AMZN)
Company Specific Risks:
- Aggressive AI Infrastructure CapEx and Free Cash Flow Depletion: Management maintained an unprecedented ~$220 billion capital expenditure projection for 2026—with single-quarter infrastructure spending climbing to $77.3 billion and commentary signaling even higher spending in 2027—plunging trailing twelve-month free cash flow to negative $42.4 billion and forcing reliance on external debt financing.
- High-Margin Digital Advertising Deceleration: Third-quarter advertising revenue reached $19.6 billion, missing consensus estimates of $20.8 billion and slowing to 11% year-over-year growth, its weakest pace in nearly four years, directly eroding the high-margin revenue stream required to subsidize core retail and AI investments.
- Consolidated Top-and-Bottom-Line Earnings Miss: Total third-quarter revenue of $201.94 billion missed consensus forecasts of $202.22 billion, while diluted earnings per share dropped year-over-year to $1.89 (missing estimates of $1.96–$1.97), reflecting an operational duration mismatch where massive upfront depreciation and computing build-outs dilute immediate profitability.
- Balance Sheet Deterioration and Growing Leverage Burden: Heavy infrastructure capital commitments have shifted Amazon from a net-cash into a net-debt position, driving debt-to-assets to 23.7% and requiring large debt offerings that elevate fixed interest obligations while constraining capital allocation flexibility such as share repurchases.
This article may include AI-generated content that is human-reviewed, which is for reference and general information purposes only and does not constitute investment advice.
Recommended Articles








Comments (0)
Click the $ button, enter the symbol, and select to link a stock, ETF, or other ticker.