


Meta Platforms Inc Stock (META) Moved Down by 5.18% on Nov 5: Drivers Behind the Movement


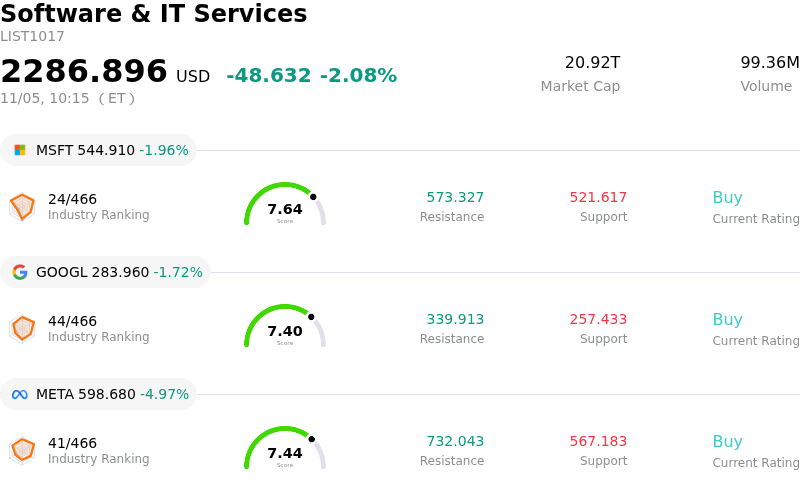
Meta Platforms Inc (META) moved down by 5.18%. The Software & IT Services sector is down by 2.08%. The company underperformed the industry. Top 3 stocks by turnover in the sector: Microsoft Corp (MSFT) down 2.02%; Alphabet Inc Class A (GOOGL) down 1.72%; Meta Platforms Inc (META) down 5.18%.
What is driving Meta Platforms Inc (META)’s stock price down today?
Meta Platforms experienced substantial downward pressure during today's trading session, driven by a confluence of escalating capital expenditure concerns, macroeconomic headwinds impacting digital advertising sentiment, and sector-wide institutional portfolio rebalancing.
The primary catalyst weighing on the stock centers on market apprehension regarding the trajectory of the company's aggressive infrastructure investments. Institutional investors remain increasingly sensitive to the mounting capital expenditure cycle required to build out proprietary artificial intelligence hardware, datacenter clusters, and custom silicon. While management continues to prioritize long-term dominance across generative AI models and recommendation architectures, market participants are scrutinizing the near-term timeline for tangible monetization. The prospect of sustained margin compression across the Family of Apps segment, alongside persistent operating losses within Reality Labs, has prompted institutional models to trim medium-term free cash flow estimates.
Simultaneously, broader macroeconomic indicators have injected caution into the digital advertising landscape. As enterprise marketers closely evaluate consumer spending trends and interest rate expectations, forward-looking commentary points to pockets of budget deceleration, particularly across non-essential discretionary and retail categories. Given that advertising inventory pricing and impression volume are highly levered to global macroeconomic stability, any perceived softening in advertising demand across Facebook and Instagram immediately impacts Meta's core revenue engine.
Industry and regulatory dynamics have compounded these valuation headwinds. Ongoing compliance obligations under global digital market and data privacy regulations continue to create operational friction, threatening targeted ad delivery efficiency and increasing platform compliance costs. Additionally, heightened scrutiny over competitive market positioning and cross-platform ecosystem policies continues to cast a recurring overhang on institutional sentiment.
From a market structure perspective, the broader technology sector faced noticeable risk-off positioning, amplifying today's sell-off. As benchmark sovereign yields fluctuated, high-multiple mega-cap tech equities faced systematic de-risking from multi-asset hedge funds and systematic equity strategies. This institutional rotation, coupled with several Wall Street research desks recalibrating risk-reward profiles and moderating tactical target valuations, accelerated downside momentum throughout the session. Meta's near-term recovery will largely hinge on management's ability to demonstrate direct returns on its AI capital outlays while preserving operating margins across its primary monetization channels.
Technical Analysis of Meta Platforms Inc (META)
Technically, Meta Platforms Inc (META) shows a MACD (12,26,9) value of -15.079, indicating a sell signal. The RSI at 33.808 suggests neutral condition and the Williams %R at 99.887 suggests oversold condition. Please monitor closely.
Media Coverage of Meta Platforms Inc (META)
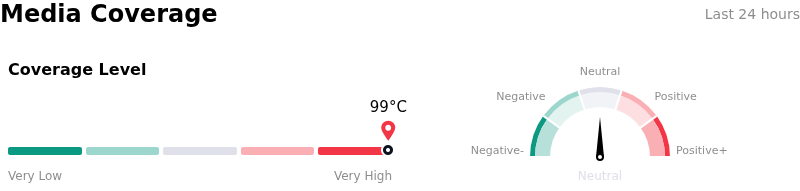
In terms of media coverage, Meta Platforms Inc (META) shows a coverage score of 99, indicating a very high level of media attention. The overall market sentiment index is currently in neutral zone.
Fundamental Analysis of Meta Platforms Inc (META)
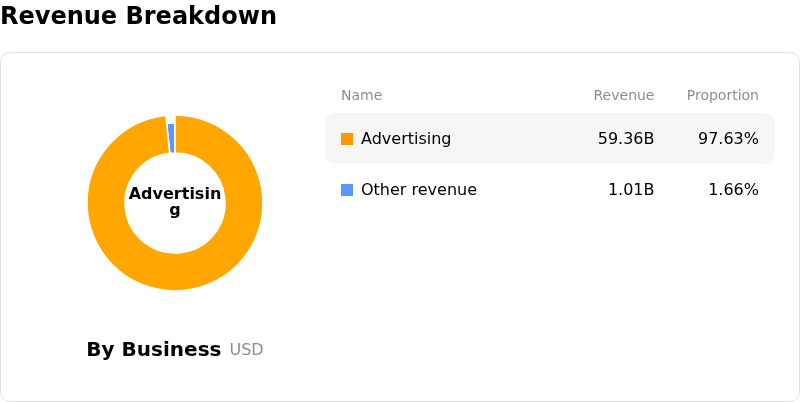
Meta Platforms Inc (META) is in the Software & IT Services industry. Its latest annual revenue is $200.97B, ranking 4 in the industry. The net profit is $60.46B, ranking 4 in the industry. Company Profile
Over the past month, multiple analysts have rated the company as Buy, with an average price target of $848.26, a high of $1050.00, and a low of $629.06.
More details about Meta Platforms Inc (META)
Company Specific Risks:
- Surging Capex and Sustained Free Cash Flow Deficits: Meta's aggressive AI infrastructure spending—with 2026 capex guidance elevated to $135B–$145B—resulted in a quarterly free cash flow deficit of $2.1 billion, prompting S&P Global Ratings to revise the company's credit outlook to negative over concerns of multi-year cash burn.
- Capital Structure Dilution and Debt Burden: To finance its massive infrastructure commitments, Meta is turning to heavy external funding, including mega-scale bond offerings and proposed Class C stock and convertible preferred equity issuances, fueling institutional anxiety over increased balance sheet leverage and shareholder dilution.
- Mounting Litigation Charges and Regulatory Setbacks: Ongoing legal scrutiny continues to impair profitability, highlighted by an estimated $9.9 billion youth-safety litigation charge and a recent UK court defeat compelling the platform to disclose sensitive social media safety and user metrics.
- Political and Permitting Bottlenecks for Data Center Expansion: Executive commentary disclosed growing political pushback and local community opposition to new hyperscale data center projects, creating execution risks and potential construction delays that threaten Meta's rapid computing deployment roadmap.
This article may include AI-generated content that is human-reviewed, which is for reference and general information purposes only and does not constitute investment advice.
Recommended Articles









Comments (0)
Click the $ button, enter the symbol, and select to link a stock, ETF, or other ticker.