


Petroleo Brasileiro SA Petrobras Stock (PBR) Moved Down by 4.13% on Nov 2: What Signal Does It Send?


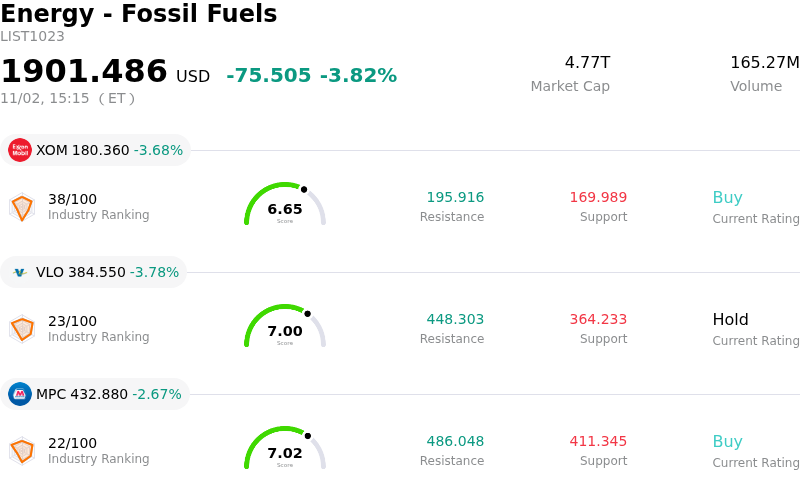
Petroleo Brasileiro SA Petrobras (PBR) moved down by 4.13%. The Energy - Fossil Fuels sector is down by 3.82%. The company underperformed the industry. Top 3 stocks by turnover in the sector: Exxon Mobil Corp (XOM) down 3.71%; Valero Energy Corp (VLO) down 3.78%; Marathon Petroleum Corp (MPC) down 2.63%.
What is driving Petroleo Brasileiro SA Petrobras (PBR)’s stock price down today?
Petrobras experienced selling pressure driven primarily by ongoing investor anxiety surrounding Brazilian political developments and energy policy uncertainty. Re-emerging market concerns regarding potential state influence over domestic fuel pricing mechanisms, capital expenditure mandates, and future dividend distributions have heightened fiscal risk premiums on Brazilian state-controlled assets. Despite the state-run energy giant maintaining strong cash generation, policy overhang and regulatory uncertainty continue to prompt risk-off adjustments among international fund managers.
The downturn was further exacerbated by broader volatility in global crude oil markets, which directly impacts realized pricing and cash flow projections for upstream producers. Additionally, institutional investors are adopting a cautious stance ahead of the company's upcoming quarterly financial results release. While Petrobras recently demonstrated operational momentum with record offshore pre-salt production and high refinery utilization rates, market participants remain focused on how weaker global crude benchmarks could compress operating margins and potentially limit future capital distributions.
From a market structure perspective, technical indicators signaled waning upside momentum following the stock's elevated levels reached earlier in the autumn. Key technical metrics, including momentum indicators crossing into negative territory and moving averages signaling consolidation, triggered automated sell programs and systematic hedging activity. This technical unwinding, combined with broad profit-taking across Latin American equities, created additional intraday downward momentum as investors repositioned across the energy sector.
Technical Analysis of Petroleo Brasileiro SA Petrobras (PBR)
Technically, Petroleo Brasileiro SA Petrobras (PBR) shows a MACD (12,26,9) value of -1.284, indicating a neutral signal. The RSI at 35.821 suggests neutral condition and the Williams %R at 99.623 suggests oversold condition. Please monitor closely.
Fundamental Analysis of Petroleo Brasileiro SA Petrobras (PBR)
Petroleo Brasileiro SA Petrobras (PBR) is in the Energy - Fossil Fuels industry. Its latest annual revenue is $88.94B, ranking 11 in the industry. The net profit is $19.69B, ranking 3 in the industry. Company Profile
Over the past month, multiple analysts have rated the company as Buy, with an average price target of $23.56, a high of $31.00, and a low of $14.50.
More details about Petroleo Brasileiro SA Petrobras (PBR)
Company Specific Risks:
- State Intervention and Political Volatility: Recent election dynamics in Brazil triggered a sharp sell-off in Petrobras ADRs, with market participants pricing in heightened risk of government interference in corporate governance and potential domestic fuel price caps.
- Dividend Distribution and Capital Reallocation Threat: Wall Street analysts highlight rising risk that the state-controlled entity will reduce lucrative shareholder dividend payouts to reallocate free cash flow toward government-directed capital projects and domestic subsidies.
- Medium-Term EPS Contraction Projections: Consensus estimates indicate a potential drop of nearly 25% in 2027 earnings per share relative to 2026 targets, driven by projected margin compression, softening global energy benchmarks, and elevated capital expenditures.
- Technical Breakdown and Negative Intraday Momentum: High volatility has driven key technical indicators into bearish territory—including momentum dropping below zero and technical RSI roll-overs—exacerbating downside pressure and institutional selling.
This article may include AI-generated content that is human-reviewed, which is for reference and general information purposes only and does not constitute investment advice.
Recommended Articles







Comments (0)
Click the $ button, enter the symbol, and select to link a stock, ETF, or other ticker.