


Palo Alto Networks Inc Stock (PANW) Moved Down by 3.40% on Nov 2: What Signal Does It Send?


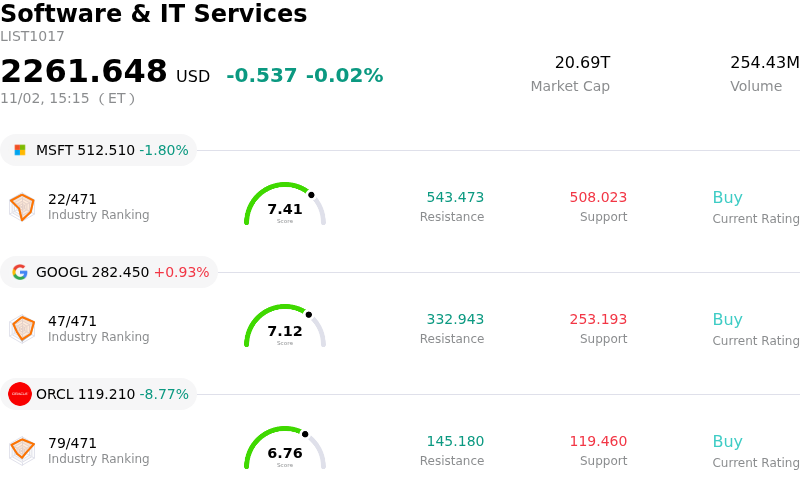
Palo Alto Networks Inc (PANW) moved down by 3.40%. The Software & IT Services sector is down by 0.02%. The company underperformed the industry. Top 3 stocks by turnover in the sector: Microsoft Corp (MSFT) down 1.77%; Alphabet Inc Class A (GOOGL) up 0.92%; Oracle Corp (ORCL) down 8.77%.
What is driving Palo Alto Networks Inc (PANW)’s stock price down today?
Palo Alto Networks experienced downward momentum as investors engaged in profit-taking following a prolonged period of strong performance. With high valuation multiples relative to historical averages, the market showed heightened sensitivity toward high-growth cybersecurity equities. Position adjustments ahead of the company's upcoming quarterly financial report further fueled intraday volatility, as market participants reassessed risk exposure across elevated enterprise software valuations.
Institutional trading disclosures highlight active portfolio rebalancing across several major technology and sector-focused exchange-traded funds. Large tech-oriented funds, including prominent index-tracking and software sector ETFs, recorded net sales in the asset, driven by institutional reallocations and index weighting updates. Although long-term institutional ownership remains robust, concentrated selling from major funds overwhelmed immediate buying liquidity, placing short-term drag on the stock.
Market sentiment has also been tempered by recent insider transaction disclosures showing net sales by corporate executives over preceding months. While insider selling frequently aligns with pre-scheduled executive compensation plans, it contributed to a cautious posture among retail and momentum traders during a period of wider market chop. Investors continue to weigh these short-term capital flows against solid core fundamentals, including healthy enterprise demand for platform-centric artificial intelligence cybersecurity solutions and growing platform consolidation across enterprise clients.
Technical Analysis of Palo Alto Networks Inc (PANW)
Technically, Palo Alto Networks Inc (PANW) shows a MACD (12,26,9) value of -2.976, indicating a sell signal. The RSI at 42.680 suggests neutral condition and the Williams %R at 73.964 suggests sell condition. Please monitor closely.
Media Coverage of Palo Alto Networks Inc (PANW)
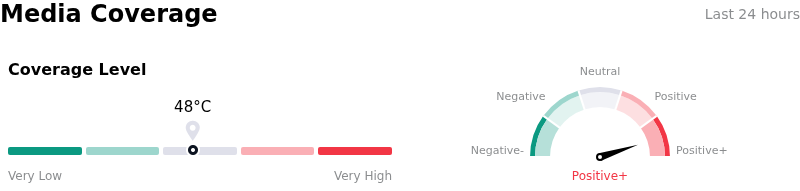
In terms of media coverage, Palo Alto Networks Inc (PANW) shows a coverage score of 48, indicating a moderate level of media attention. The overall market sentiment index is currently in extremely bullish zone.
Fundamental Analysis of Palo Alto Networks Inc (PANW)
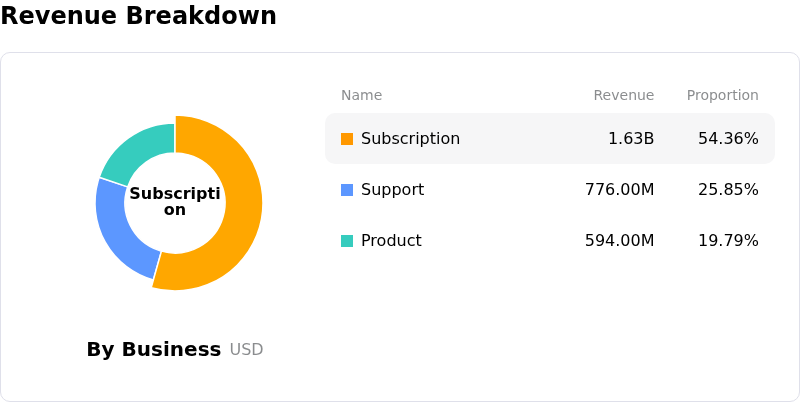
Palo Alto Networks Inc (PANW) is in the Software & IT Services industry. Its latest annual revenue is $11.48B, ranking 33 in the industry. The net profit is $307.00M, ranking 90 in the industry. Company Profile
Over the past month, multiple analysts have rated the company as Buy, with an average price target of $400.15, a high of $525.00, and a low of $190.00.
More details about Palo Alto Networks Inc (PANW)
Company Specific Risks:
- Peer Earnings Spillover and Sector Contagion: Disappointing quarterly metrics and decelerating growth disclosures from key cybersecurity peers, such as Fortinet, have triggered broad sector-wide profit-taking and selling pressure that directly impacts Palo Alto Networks.
- Valuation Compression and Analyst Downgrades: Trading at an elevated valuation multiple near 97x forward earnings—substantially above historical medians—the stock has received analyst downgrades to Hold or Neutral ratings, leaving shares highly vulnerable to position trimming during sector sell-offs.
- NGS ARR Growth Deceleration and Margin Constraints: Projections indicating a sharp moderation in Next-Generation Security Annual Recurring Revenue growth to 22%–23% in fiscal 2027 from 63% in fiscal 2026 fuel institutional concerns over decelerating top-line expansion, alongside GAAP margin constraints driven by stock-based compensation and acquisition overhead.
- Software Vulnerability Disclosures and Operational Risk: Disclosures regarding high-severity software vulnerabilities in PAN-OS requiring emergency hotfix releases expose technical execution risks and potential enterprise operational disruptions.
This article may include AI-generated content that is human-reviewed, which is for reference and general information purposes only and does not constitute investment advice.
Recommended Articles






Comments (0)
Click the $ button, enter the symbol, and select to link a stock, ETF, or other ticker.