


Alphabet Inc Class C Stock (GOOG) Opened Down by 12.59% on Oct 29: Key Drivers Unveiled



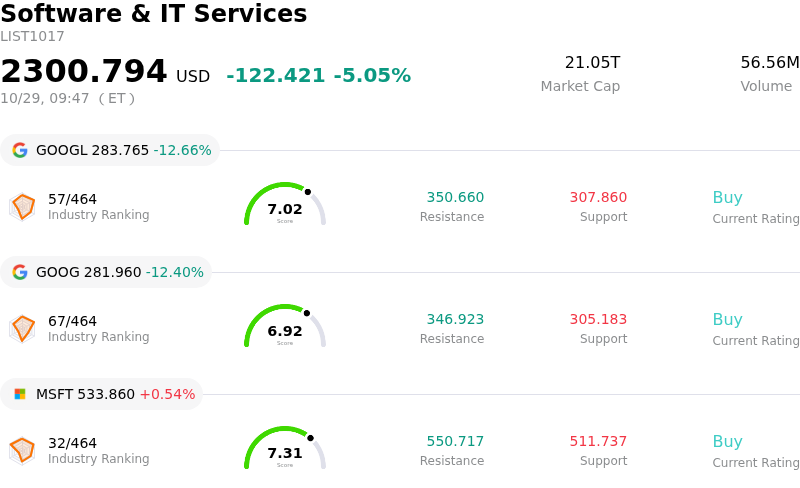
Alphabet Inc Class C (GOOG) opened down by 12.59%. The Software & IT Services sector is down by 5.05%. The company underperformed the industry. Top 3 stocks by turnover in the sector: Alphabet Inc Class A (GOOGL) down 12.82%; Alphabet Inc Class C (GOOG) down 12.59%; Microsoft Corp (MSFT) up 1.55%.
What is driving Alphabet Inc Class C (GOOG)’s stock price down today?
Alphabet experienced severe selling pressure following the release of its third-quarter financial results, which missed Wall Street consensus on both top-line revenue and bottom-line earnings per share. While total revenue posted 25% year-over-year growth, the figure fell slightly below market projections. The main driver of institutional unease was a deceleration in Google Search and advertising revenue growth, which expanded at 12%—slower than in the prior quarter—and missed analyst expectations. This slowing growth exacerbated market anxieties that conversational artificial intelligence platforms and alternative search interfaces are beginning to disrupt traditional search query volume and ad monetization efficiency.
Compounding top-line concerns was the financial strain caused by Alphabet's aggressive AI infrastructure spending. Capital expenditures surged to $51.4 billion for the quarter as the company expanded data center capacity and computing hardware, significantly outstripping quarterly cash flow and driving free cash flow to negative $9.1 billion. Management reinforced that capital outlays will remain heavy through the fourth quarter and rise significantly in fiscal 2027. Investors reacted negatively to the rising cost structure, growing debt load, and margin erosion, expressing skepticism over the immediate return on investment relative to the ongoing cash drain.
Bottom-line profitability was further impacted by an $8.7 billion unrealized loss in Alphabet's equity investment portfolio, primarily tied to valuation adjustments in holdings like SpaceX. Although Google Cloud delivered a strong bright spot with revenue surging 103% year-over-year to $30.7 billion due to robust enterprise AI demand, the cloud segment's momentum was overshadowed by the broader earnings miss and cash flow pressures. Until search advertising growth stabilizes and management demonstrates greater capital efficiency, market sentiment is likely to remain restrained.
Technical Analysis of Alphabet Inc Class C (GOOG)
Technically, Alphabet Inc Class C (GOOG) shows a MACD (12,26,9) value of -9.587, indicating a sell signal. The RSI at 21.935 suggests sell condition and the Williams %R at 95.582 suggests oversold condition. Please monitor closely.
Media Coverage of Alphabet Inc Class C (GOOG)
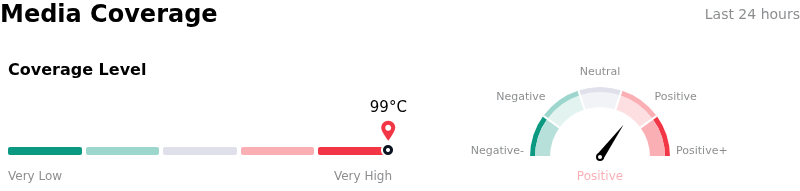
In terms of media coverage, Alphabet Inc Class C (GOOG) shows a coverage score of 99, indicating a very high level of media attention. The overall market sentiment index is currently in bullish zone.
Fundamental Analysis of Alphabet Inc Class C (GOOG)
Alphabet Inc Class C (GOOG) is in the Software & IT Services industry. Its latest annual revenue is $402.84B, ranking 1 in the industry. The net profit is $132.17B, ranking 2 in the industry. Company Profile
Over the past month, multiple analysts have rated the company as Buy, with an average price target of $423.20, a high of $485.00, and a low of $330.00.
More details about Alphabet Inc Class C (GOOG)
Company Specific Risks:
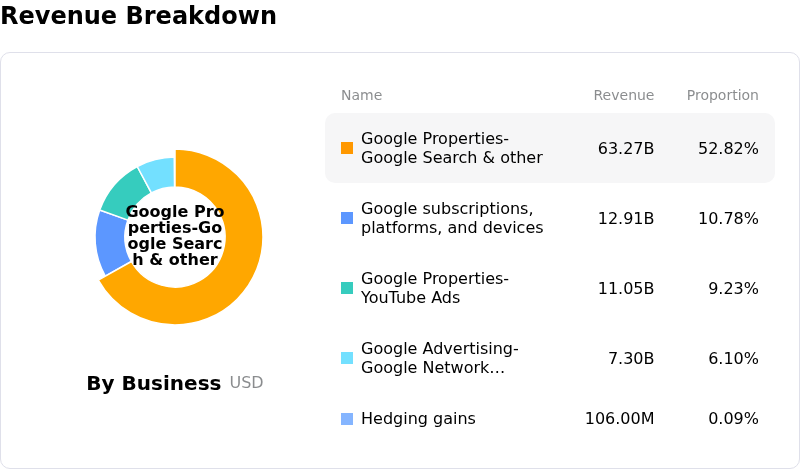
- Q3 Revenue and Earnings Miss in Core Ad Units: Alphabet reported Q3 EPS of $2.12 against a $3.02 consensus estimate, driven by underperformance in Search & Other revenue ($63.4 billion versus $65 billion expected) and YouTube ad sales ($11.2 billion versus $11.4 billion expected), triggering intraday stock declines exceeding 10%.
- Negative Free Cash Flow from Escalating AI Infrastructure Capex: Aggressive capital expenditures required for AI hardware and cloud infrastructure scaling flipped quarterly free cash flow to negative $5.9 billion, intensifying concerns over near-term margin compression and elevated cash burn rates.
- Antitrust Remedies and Ad-Tech Market Disruptions: Pending Department of Justice antitrust remedies targeting Google's ad-tech suite threaten to mandate neutral ad auctions, which risks reducing Google Ad Exchange's win rate and redirecting advertiser spend to competing platforms.
- Securities Class Action over Gemini AI Disclosures: Active securities class action litigation alleging misleading executive statements regarding development delays and disappointing training results for the flagship Gemini 3.5 Pro model introduces ongoing legal liabilities and negative market sentiment.
This article may include AI-generated content that is human-reviewed, which is for reference and general information purposes only and does not constitute investment advice.
Recommended Articles









Comments (0)
Click the $ button, enter the symbol, and select to link a stock, ETF, or other ticker.