


Bitcoin (BTCUSD) Volatility Intensified on Oct 29: What You Should Know



Bitcoin (BTCUSD) is down 1.55% at Oct 29 21:50(ET), now at $80037.61, with a 7-day down of 1.49%.
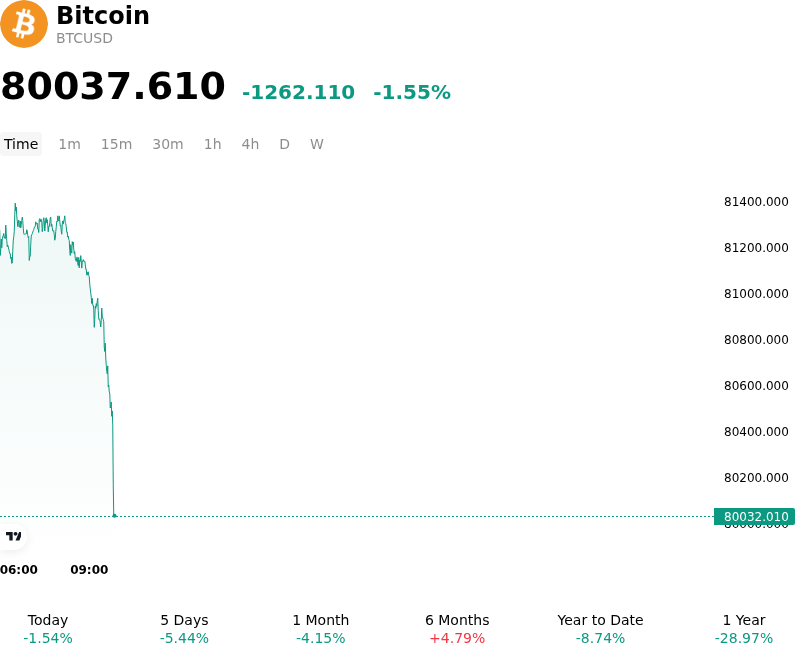
What is driving Bitcoin (BTCUSD)’s stock price down today?
Bitcoin experienced selling pressure as macroeconomic headwinds and hawkish monetary policy signals weighed on broader market risk appetite. Although the Federal Reserve maintained benchmark interest rates, the policy stance highlighted persistent inflation concerns and internal dissents favoring further monetary tightening. Elevated Treasury yields and a resilient U.S. dollar reduced investor appetite for non-yielding digital assets, prompting institutional participants to trim risk exposure across macro-sensitive asset classes.
Spot market demand and institutional capital flows also demonstrated signs of cooling, failing to generate sufficient buying pressure to support higher price levels. Key institutional indicators, including a persistently negative Coinbase premium, pointed to subdued buying interest from U.S. investors compared to offshore venues. Although spot Bitcoin exchange-traded funds recorded sporadic net inflows, the volume of incoming capital was insufficient to absorb overhead liquidity and ongoing distribution, leaving spot market conditions constrained.
From a market structure perspective, technical overhead and derivatives positioning amplified the intraday pullback. Rejection below short-term moving average resistance encouraged systematic profit-taking and defensive positioning in derivatives markets, where option implied volatility leaned heavily toward downside put protection. The resulting liquidity contraction triggered localized long liquidations, reinforcing a cautious market stance as investors evaluate macroeconomic trajectory and upcoming policy developments.
Technical Analysis of Bitcoin (BTCUSD)
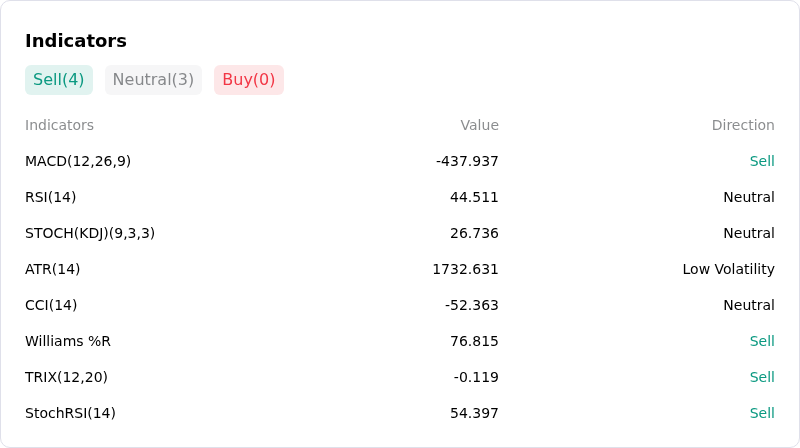
Technically, Bitcoin (BTCUSD) shows a MACD (12,26,9) value of -437.937, indicating a sell signal. The RSI at 44.511 suggests neutral condition and the Williams %R at 76.815 suggests sell condition. Please monitor closely.
More details about Bitcoin (BTCUSD)
Recent Events and Risks:
- Heavy Spot ETF Outflows: Institutional demand for BTCUSD has experienced sharp contraction, evidenced by single-day net redemptions exceeding $635 million across U.S. spot Bitcoin ETFs—led by BlackRock's IBIT and Fidelity's FBTC—reversing weekly inflows and applying direct sell pressure on spot order books.
- Leverage Overhang and Liquidation Cascades: An expansion in futures open interest alongside falling prices triggered forced unwinds, resulting in tens of millions in leveraged long liquidations as BTCUSD breached key technical support near $80,000.
- Macroeconomic Volatility and Fed Event Risk: Risk-off sentiment across global capital markets, exacerbated by rising energy prices and Middle East geopolitical tensions, has elevated trader caution ahead of the upcoming Federal Reserve interest rate decision and inflation data releases.
- Depleted Stablecoin Liquidity and Exchange Deposit Spikes: On-chain metrics reveal a contracting stablecoin market cap and notable increases in exchange-bound Bitcoin deposits, indicating growing sell-side overhead alongside diminished sidelined capital to absorb intraday price dips.
This article may include AI-generated content that is human-reviewed, which is for reference and general information purposes only and does not constitute investment advice.
Recommended Articles









Comments (0)
Click the $ button, enter the symbol, and select to link a stock, ETF, or other ticker.