


Solana (SOLUSD) Is down 1.06% on Oct 29: Key Drivers to Watch



Solana (SOLUSD) is down 1.06% at Oct 29 21:30(ET), now at $100.46, with a 7-day down of 1.88%.
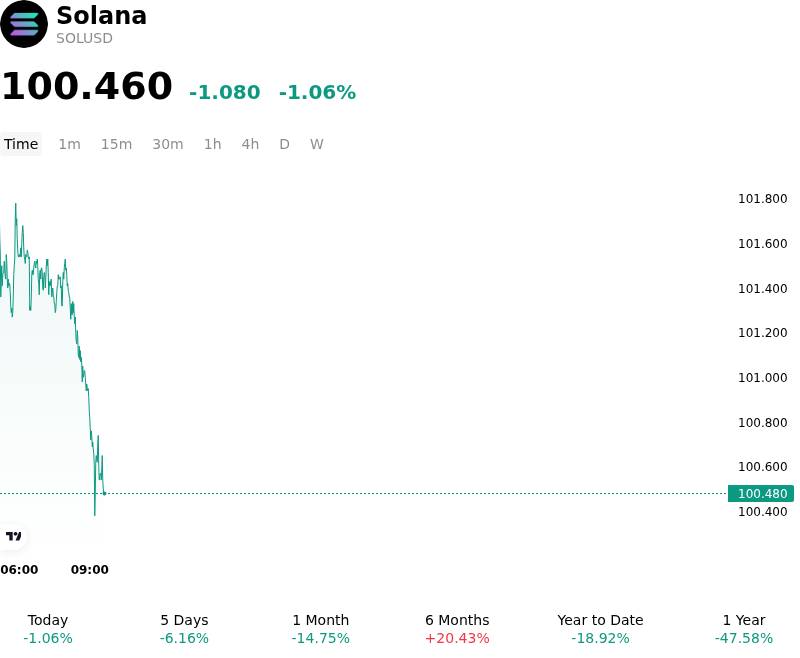
What is driving Solana (SOLUSD)’s stock price down today?
Solana experienced downside pressure during the session as a broader risk-off tone across global markets and persistent spot Solana ETF outflows weighed on institutional liquidity. Macroeconomic headwinds, characterized by elevated US Treasury yields and a resilient dollar ahead of key Federal Reserve policy decisions, tightened broader financial conditions and dampened risk appetite for high-beta digital assets. Concurrently, institutional demand through spot Solana exchange-traded funds showed signs of fatigue. Net redemptions across key structured products over recent sessions reduced spot buying power, signaling a temporary retreat among institutional allocators.
On-chain metrics further reinforced the cautious sentiment across the network. Solana ecosystem trading activity saw a localized slowdown, with decentralized exchange trading volumes and network protocol revenue moderating from earlier peak levels. Lower transaction fee generation and a slight contraction in total value locked across decentralized finance protocols pointed to reduced speculative retail participation and less aggressive capital deployment into Solana-native protocols. While underlying network performance and settlement speeds remain strong following recent protocol upgrades, the immediate deceleration in fee revenue left the asset vulnerable to market-wide retracements.
In the derivatives market, the pullback triggered modest long liquidations and a contraction in total open interest as leveraged traders unwound bullish exposure near key moving average resistance. Trading below key technical thresholds reinforced short-term defensive positioning, with futures traders opting to reduce leverage rather than defend lower support boundaries. Moving forward, institutional market participants will closely monitor Federal Reserve monetary policy guidance, the stabilization of spot ETF fund flows, and a potential resurgence in decentralized exchange trading volumes as essential conditions for establishing a sustainable structural recovery.
Technical Analysis of Solana (SOLUSD)
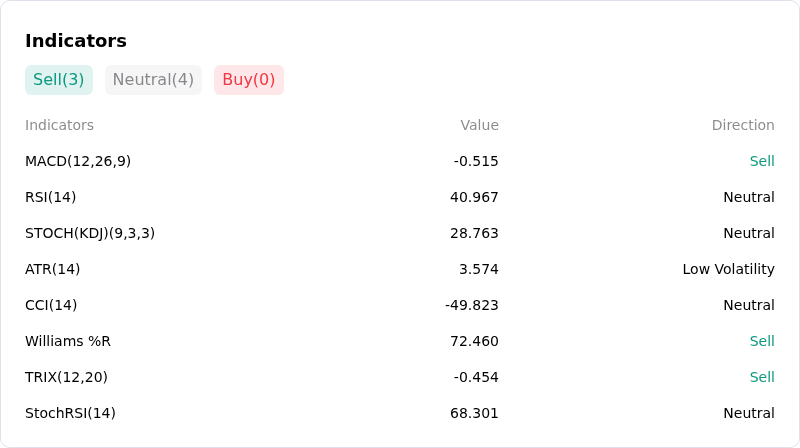
Technically, Solana (SOLUSD) shows a MACD (12,26,9) value of -0.515, indicating a sell signal. The RSI at 40.967 suggests neutral condition and the Williams %R at 72.460 suggests sell condition. Please monitor closely.
More details about Solana (SOLUSD)
Recent Events and Risks:
- Accelerating Institutional ETF Outflows: U.S. spot Solana exchange-traded funds experienced their largest single-day net redemptions since late 2025, recording $19.16 million in withdrawals on October 27 and pushing cumulative October outflows toward $100 million, significantly weakening institutional spot demand.
- Derivatives Liquidation and Leverage Purge: Solana perps face aggressive taker sell pressure and declining open interest, leaving long positions vulnerable to cascading liquidations as SOL hovers near high-density leverage liquidation clusters estimated near $99.57.
- Technical Breakdown of Key Support: SOL/USD is struggling to maintain its crucial $100 psychological floor, threatening to confirm a daily head-and-shoulders pattern that technical analysts warn could spark a secondary 20% decline toward the $80–$88 support zone.
- Post-Upgrade Sell-the-News Volatility: Market sentiment following the October 21 Alpenglow mainnet upgrade has morphed into a "sell-the-news" event, as real-world median finality measurements of 404 ms lagged behind the 150 ms target, accelerating a 2.1% drop in the SOL/BTC ratio.
This article may include AI-generated content that is human-reviewed, which is for reference and general information purposes only and does not constitute investment advice.
Recommended Articles









Comments (0)
Click the $ button, enter the symbol, and select to link a stock, ETF, or other ticker.