


XRP (XRPUSD) Is down 1.08% on Oct 29: What Are the Risk Factors?



XRP (XRPUSD) is down 1.08% at Oct 29 21:10(ET), now at $1.3167, with a 7-day up of 1.22%.
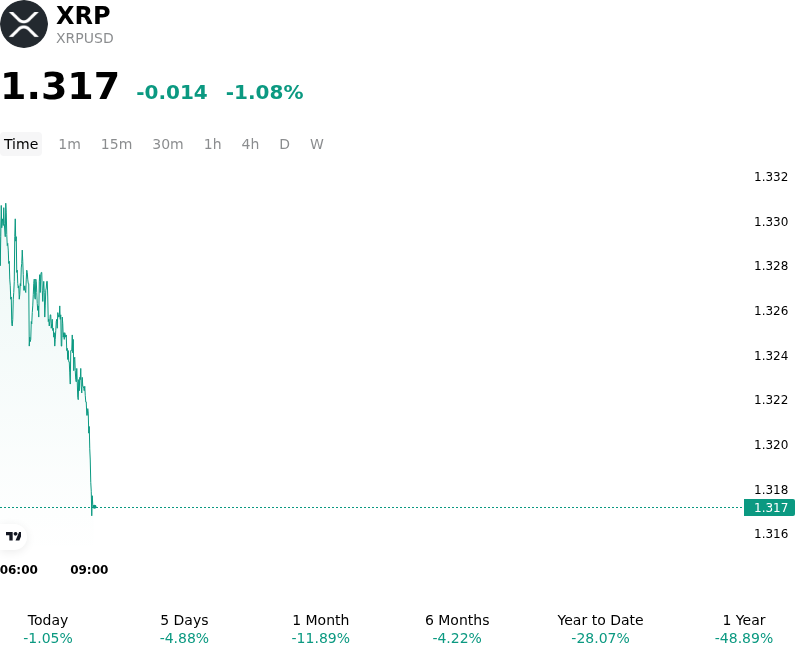
What is driving XRP (XRPUSD)’s stock price down today?
The recent decline in XRP reflects a combination of event-driven profit-taking, slowing spot fund inflows, and macro-driven risk aversion across the broader digital asset market. While market sentiment earlier in the quarter was supported by regulatory progress and institutional product development, short-term price action turned defensive as speculative expectations encountered a lack of immediate spot-buying catalysts.
A primary driver behind the pullback is the divergence between enterprise adoption news and direct spot asset demand. Announcements surrounding corporate payment infrastructure, institutional custody, and stablecoin initiatives highlighted ongoing ecosystem development, yet many of these cross-border settlement solutions operate via automated liquidity rails that rapidly convert assets without mandating long-term open-market token retention. As a result, market participants who anticipated direct institutional token accumulation chose to reduce long exposure, creating a classic sell-the-news dynamic following corporate presentations.
From a positioning and liquidity perspective, the pullback was reinforced by subtle leverage unwinding in crypto derivatives markets. A contraction in futures open interest, coupled with high retail long positioning, left the asset vulnerable to downside pressure near key overhead resistance levels. Concurrently, daily capital flows into spot XRP exchange-traded products moderated after an initial period of strong demand, removing a key source of price inelastic buying support. On the macroeconomic front, sticky inflation data and shifting Federal Reserve interest rate expectations contributed to broader market risk reduction, weighing heavily on alternative digital assets.
Institutional investors continue to track several ongoing factors, including scheduled token escrow unlocks, the implementation of new regulatory frameworks for payment tokens, and whether spot vehicle creations re-accelerate. Until spot institutional flows demonstrate sustained growth or protocol-level mechanics require permanent asset locking, XRP is likely to remain in a consolidated range tied closely to broader macroeconomic liquidity and crypto market beta.
Technical Analysis of XRP (XRPUSD)
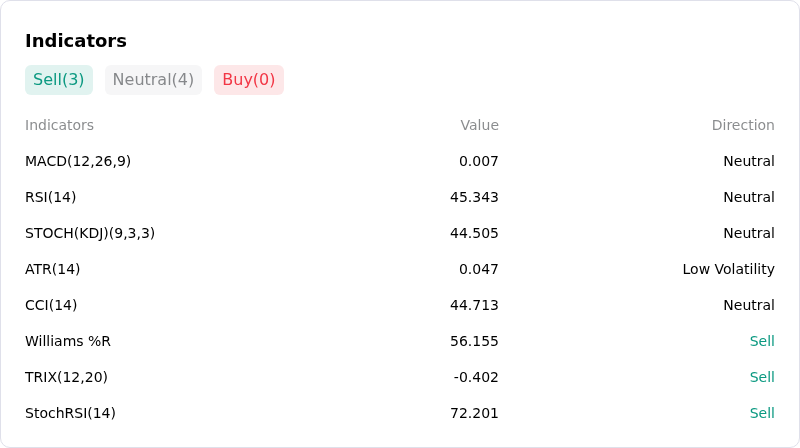
Technically, XRP (XRPUSD) shows a MACD (12,26,9) value of 0.007, indicating a neutral signal. The RSI at 45.641 suggests neutral condition and the Williams %R at 54.495 suggests neutral condition. Please monitor closely.
More details about XRP (XRPUSD)
Recent Events and Risks:
- Leverage Unwinds and Derivatives Liquidations: Accelerated long position liquidations across crypto derivatives markets triggered a heavy downside liquidation imbalance in XRP, forcing intraday prices lower toward the critical $1.26–$1.28 support range and heightening vulnerability to further cascading liquidations.
- Whale Wallet Distribution and Exchange Inflows: On-chain data indicates an active distribution phase among large holders, with tier-one whale wallets holding 10 million to 100 million XRP decreasing from 351 to 339, alongside an influx of nearly 50 million tokens deposited onto centralized exchanges, increasing overhead selling pressure.
- Technical Breakdown and Downside Price Risk: Trading dangerously close to the lower boundary of its multi-month rising price channel, XRP risks a technical breakdown below $1.26, which analysts warn could open a pathway toward secondary support targets at $1.11 and $0.98.
- Protocol Upgrade Setbacks and Cooling Institutional Flows: The deployment of the core fixCleanup amendment on the XRP Ledger experienced delays following a temporary drop in validator consensus below the 80% threshold, while institutional demand slowed as net inflows into spot XRP products experienced a notable deceleration.
This article may include AI-generated content that is human-reviewed, which is for reference and general information purposes only and does not constitute investment advice.
Recommended Articles










Comments (0)
Click the $ button, enter the symbol, and select to link a stock, ETF, or other ticker.