


Flex Ltd Stock (FLEX) Moved Up by 9.50% on Oct 28: Facts Behind the Movement



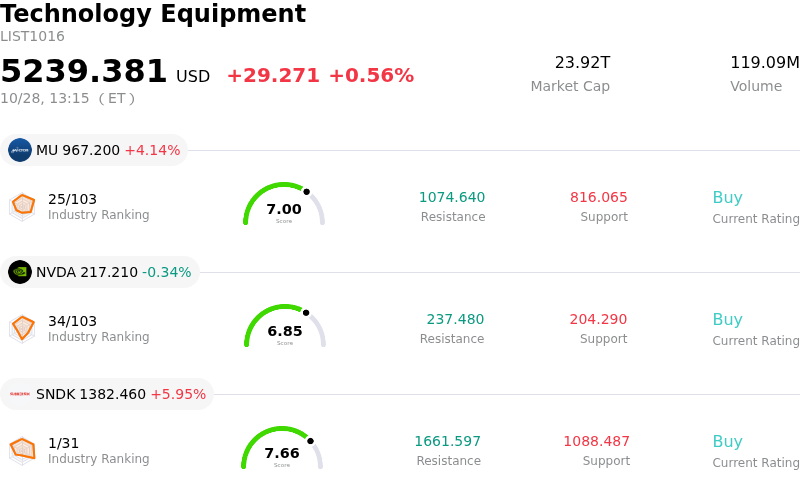
Flex Ltd (FLEX) moved up by 9.50%. The Technology Equipment sector is up by 0.56%. The company outperformed the industry. Top 3 stocks by turnover in the sector: Micron Technology Inc (MU) up 4.17%; NVIDIA Corp (NVDA) down 0.31%; SanDisk Corporation (SNDK) up 5.99%.
What is driving Flex Ltd (FLEX)’s stock price up today?
Flex Ltd. experienced a sharp upward move following the publication of its fiscal second-quarter 2027 financial results, which exceeded Wall Street expectations on both top-line revenue and bottom-line earnings. The electronics manufacturing and supply chain solutions provider posted revenue driven by twenty-five percent year-over-year growth, alongside record adjusted earnings per share that comfortably beat consensus estimates. A primary catalyst behind the outperformance was intense demand across artificial intelligence hardware and data center power ecosystems. The company’s Cloud and Power Infrastructure business segment delivered fifty-four percent year-over-year growth, demonstrating that robust enterprise spending on AI computing, specialized cooling, and power management is translating directly into higher manufacturing volumes and expanded profit margins.
Compounding the positive quarterly performance, management raised its full-year fiscal 2027 guidance for sales, operating margins, and adjusted earnings per share. Flex signaled accelerating momentum heading into the second half of the fiscal year, anchored by ongoing progress in separating its high-growth Cloud and Power Infrastructure segment into a standalone company, named Axiom, targeted for completion in early calendar 2027. Additionally, the integration of recent strategic acquisitions, such as EPC Power, has enhanced Flex's end-to-end power portfolio, reinforcing its competitive positioning in high-value infrastructure markets. The strong operational beat and upgraded corporate outlook served as an immediate positive catalyst, providing fundamental reassurance to investors and driving a sharp upward repricing after weeks of recent stock consolidation.
Technical Analysis of Flex Ltd (FLEX)
Technically, Flex Ltd (FLEX) shows a MACD (12,26,9) value of -3.030, indicating a sell signal. The RSI at 42.754 suggests neutral condition and the Williams %R at 63.043 suggests sell condition. Please monitor closely.
Fundamental Analysis of Flex Ltd (FLEX)
Flex Ltd (FLEX) is in the Technology Equipment industry. Its latest annual revenue is $27.91B, ranking 2 in the industry. The net profit is $880.00M, ranking 6 in the industry. Company Profile
Over the past month, multiple analysts have rated the company as Buy, with an average price target of $158.89, a high of $180.00, and a low of $135.00.
More details about Flex Ltd (FLEX)
Company Specific Risks:
- Free Cash Flow Contraction: In its Q2 fiscal 2027 Form 8-K filing, six-month free cash flow dropped to $302 million from $573 million in the year-earlier period, heavily constrained by rising separation costs tied to its corporate restructuring.
- Spin-Off Contingent Liabilities: The planned separation of the Cloud and Power Infrastructure segment (Axiom Solutions International) creates balance-sheet exposure due to a $2.0 billion preferred equity agreement that imposes a mandatory redemption guarantee of up to 125% if the transaction is delayed or not completed by December 31, 2027.
- Elevated Debt and Leverage Pressures: Financial risk has escalated following a $1.1 billion draw on a bridge credit facility to fund the EPC Power acquisition, compounding interest expense liabilities alongside rising capital expenditure demands for AI data-center infrastructure.
- Analyst Valuation Re-ratings: Wall Street analysts, including BofA Securities, lowered their price targets on FLEX to reflect reduced valuation multiples, driven by scrutiny over higher debt burdens, preferred share dilution, and overall transaction execution complexity.
This article may include AI-generated content that is human-reviewed, which is for reference and general information purposes only and does not constitute investment advice.
Recommended Articles








Comments (0)
Click the $ button, enter the symbol, and select to link a stock, ETF, or other ticker.