


Celestica Inc Stock (CLS) Moved Up by 7.54% on Oct 28: Drivers Behind the Movement



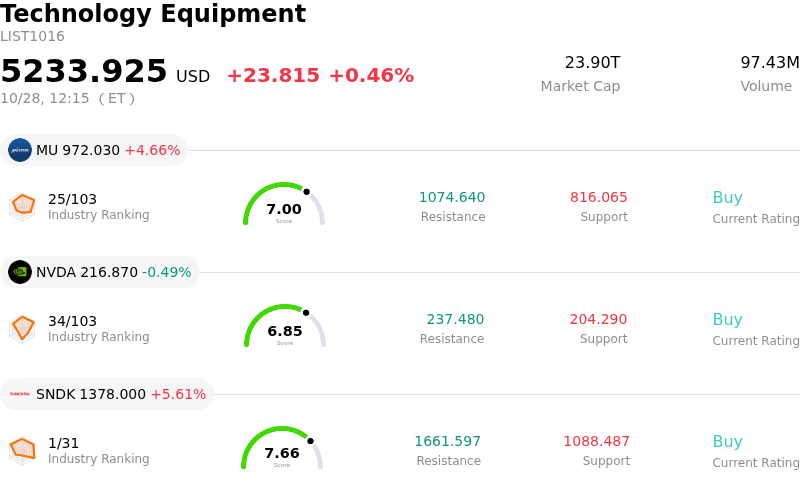
Celestica Inc (CLS) moved up by 7.54%. The Technology Equipment sector is up by 0.46%. The company outperformed the industry. Top 3 stocks by turnover in the sector: Micron Technology Inc (MU) up 4.67%; NVIDIA Corp (NVDA) down 0.47%; SanDisk Corporation (SNDK) up 5.61%.
What is driving Celestica Inc (CLS)’s stock price up today?
Celestica experienced strong upward momentum accompanied by heightened intraday volatility following the release of its third-quarter financial results and long-term strategic outlook. The surge in buying interest was primarily driven by top- and bottom-line outperformance that comfortably surpassed Wall Street expectations, alongside an aggressive upward revision to forward guidance that reinforced the company's pivotal position in the global artificial intelligence infrastructure buildout.
The primary catalyst behind the positive price movement was the explosive growth in Celestica's Connectivity and Cloud Solutions segment. Strong demand from major cloud hyperscalers for custom AI compute platforms and next-generation 800G and 1.6T optical networking switches propelled total revenue up eighty-three percent year over year to $5.83 billion. Furthermore, strong operational execution and high asset utilization enabled adjusted operating margins to hit a company record of 8.5%, leading to adjusted earnings per share of $3.30 that significantly outpaced consensus estimates.
Investor sentiment was further bolstered by management's ambitious forward guidance. Celestica raised its full-year 2026 revenue outlook to $21.0 billion and adjusted earnings per share to $11.55. More significantly, management delivered a striking long-term forecast for 2027, projecting revenue to nearly double to $40.0 billion alongside adjusted earnings per share of $21.50. Executive commentary highlighted robust visibility into customer demand backed by already-awarded hyperscaler programs extending through 2028, effectively assuaging market fears of an impending slowdown in artificial intelligence capital spending.
Despite the bullish long-term narrative, intraday trading exhibited noticeable swings as market participants evaluated the short-term capital requirements required to support this rapid expansion. Management lowered its full-year 2026 free cash flow forecast to $460 million to fund substantial working capital investments and inventory accumulation ahead of major 2027 program deployments. While higher capital expenditure needs prompted minor price target recalibrations from sell-side analysts, institutional investors ultimately focused on the company's expanding operating leverage and multi-year growth trajectory, sustaining significant upward pressure on the equity.
Technical Analysis of Celestica Inc (CLS)
Technically, Celestica Inc (CLS) shows a MACD (12,26,9) value of -12.620, indicating a sell signal. The RSI at 44.864 suggests neutral condition and the Williams %R at 57.926 suggests sell condition. Please monitor closely.
Fundamental Analysis of Celestica Inc (CLS)
Celestica Inc (CLS) is in the Technology Equipment industry. Its latest annual revenue is $12.39B, ranking 8 in the industry. The net profit is $832.50M, ranking 8 in the industry. Company Profile
Over the past month, multiple analysts have rated the company as Buy, with an average price target of $451.52, a high of $535.00, and a low of $375.00.
More details about Celestica Inc (CLS)
Company Specific Risks:
- Reduced Free Cash Flow Guidance and Escalating Capital Spending: Management lowered full-year 2026 free cash flow guidance from $600 million to $460 million due to a surge in inventory to $4.5 billion and planned capital expenditures between $1.5 billion and $2.0 billion to fund upcoming AI infrastructure production ramps.
- Extreme Revenue Concentration Among Key Buyers: Third-quarter financial disclosures revealed that Celestica generates 66% of its total revenue from just three hyperscale customers (accounting for 35%, 17%, and 14% individually), leaving financial performance highly susceptible to order adjustments or spending cuts by key accounts.
- Equity Dilution and Persistent Insider Stock Liquidation: Capital funding initiatives resulted in roughly 8.3% equity dilution from secondary share issuance, while SEC filings and market data show substantial insider stock selling totaling over $89 million in recent months, dampening investor sentiment.
- Exposure to AI Sector Volatility and Potential Margin Compression: Analysts highlight persistent risks of margin compression stemming from product mix shifts toward higher-revenue but lower-margin enterprise systems, leaving profitability exposed to broader AI infrastructure spending pullbacks.
This article may include AI-generated content that is human-reviewed, which is for reference and general information purposes only and does not constitute investment advice.
Recommended Articles








Comments (0)
Click the $ button, enter the symbol, and select to link a stock, ETF, or other ticker.