


CME Group Inc Stock (CME) Moved Down by 4.23% on Oct 27: What Signal Does It Send?



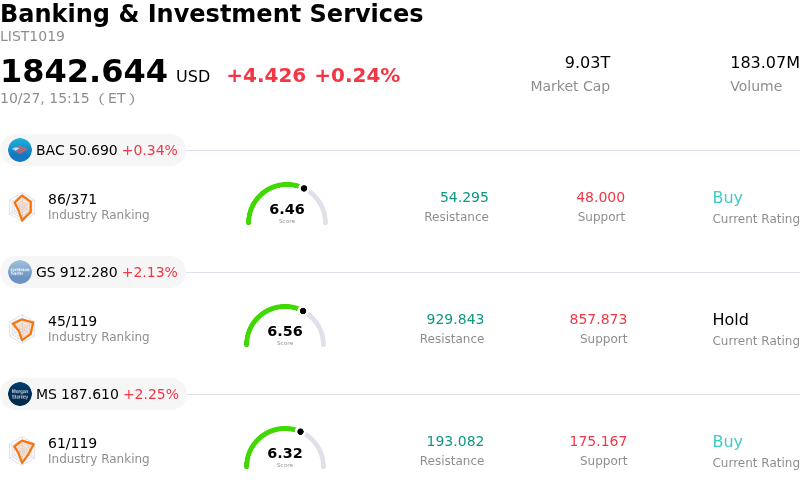
CME Group Inc (CME) moved down by 4.23%. The Banking & Investment Services sector is up by 0.24%. The company underperformed the industry. Top 3 stocks by turnover in the sector: Bank of America Corp (BAC) up 0.36%; Goldman Sachs Group Inc (GS) up 2.13%; Morgan Stanley (MS) up 2.25%.
What is driving CME Group Inc (CME)’s stock price down today?
CME Group experienced downward pressure as market participants reassessed valuations following the exchange operator's third-quarter earnings report. Although the company delivered record quarterly revenue and beat consensus earnings per share estimates, elevated operational expenses and lower-than-projected total trading volumes created friction for investors. Following a strong multi-month run-up in the stock leading into the report, profit-taking accelerated as market participants locked in recent gains amid broader equity market recalibration.
Strategic and regulatory headwinds have added to short-term pressure on the stock. Delays in regulatory approvals for key strategic product expansions, including extended review periods for compute futures and round-the-clock trading contracts, have slowed near-term revenue catalysts. Additionally, management noted that recent transaction fee adjustments are expected to yield only modest fee uplift. While international trading activity and market data revenues remain robust, quarterly volume growth relied heavily on transaction velocity rather than significant open interest expansion, leaving investors cautious about immediate top-line acceleration.
Macroeconomic conditions and institutional positioning ahead of upcoming Federal Reserve monetary policy updates further influenced trading sentiment. Financial sector holdings faced broader portfolio derisking as traders adjusted exposure ahead of central bank rate decisions. While long-term fundamentals remain supported by structural demand for global risk management tools and international expansion, the combination of valuation caution, higher expense trajectories, and regulatory friction drove the downward movement in the shares.
Technical Analysis of CME Group Inc (CME)
Technically, CME Group Inc (CME) shows a MACD (12,26,9) value of 3.856, indicating a buy signal. The RSI at 59.637 suggests neutral condition and the Williams %R at 36.563 suggests buy condition. Please monitor closely.
Media Coverage of CME Group Inc (CME)
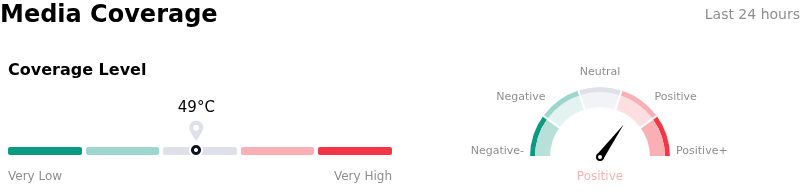
In terms of media coverage, CME Group Inc (CME) shows a coverage score of 49, indicating a moderate level of media attention. The overall market sentiment index is currently in bullish zone.
Fundamental Analysis of CME Group Inc (CME)
CME Group Inc (CME) is in the Banking & Investment Services industry. Its latest annual revenue is $11.95B, ranking 19 in the industry. The net profit is $4.02B, ranking 8 in the industry. Company Profile
Over the past month, multiple analysts have rated the company as Hold, with an average price target of $307.36, a high of $359.00, and a low of $227.00.
More details about CME Group Inc (CME)
Company Specific Risks:
- Macro Volatility Normalization Risk: Following record third-quarter trading activity of 29.4 million contracts per day, CME's top-line revenue remains deeply exposed to market volatility; any stabilization in central bank monetary policy or easing geopolitical uncertainty threatens to reduce hedging activity and compress transaction fee revenues.
- Heightened Exchange Competition & Pricing Pressure: CME faces direct competitive threats in its interest rate and Treasury complexes from aggressive market rivals such as FMX, ICE, and CBOE, creating operational risks of liquidity fragmentation and revenue-per-contract (RPC) compression as mandatory Treasury clearing regulations approach.
- Analyst Valuation Divergence & Downside Targets: Despite recent Q3 earnings beats, prominent Wall Street analysts maintain cautious stances—including Goldman Sachs (Sell rating, $271 price target) and BofA Securities (Underperform, $230 target)—citing elevated forward multiples relative to baseline fair value estimates that leave little margin for operational execution errors.
- Dividend Payout & Capital Allocation Constraints: Operating with an elevated dividend payout ratio near 95% alongside $3.4 billion in total debt obligations, CME faces tightened financial flexibility, which is further underscored by notable net insider share selling over the past 12 months ($31.1 million sold versus $0.7 million bought).
This article may include AI-generated content that is human-reviewed, which is for reference and general information purposes only and does not constitute investment advice.
Recommended Articles








Comments (0)
Click the $ button, enter the symbol, and select to link a stock, ETF, or other ticker.