


Texas Instruments Inc Stock (TXN) Moved Up by 3.16% on Oct 27: Drivers Behind the Movement



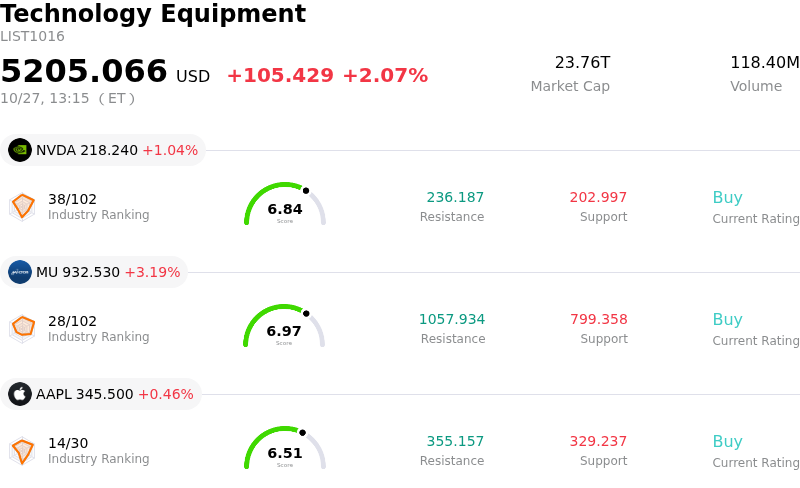
Texas Instruments Inc (TXN) moved up by 3.16%. The Technology Equipment sector is up by 2.07%. The company outperformed the industry. Top 3 stocks by turnover in the sector: NVIDIA Corp (NVDA) up 1.04%; Micron Technology Inc (MU) up 3.19%; Apple Inc (AAPL) up 0.46%.
What is driving Texas Instruments Inc (TXN)’s stock price up today?
Texas Instruments experienced solid upward price momentum as investors continued to react favorably to the company's strong third-quarter financial performance and optimistic forward guidance. Top and bottom-line growth comfortably surpassed market expectations, driven by rapid broad-based demand recovery across industrial, automotive, and data center markets. Performance was particularly energized by exponential growth in artificial intelligence data center infrastructure and a rebound in analog and embedded processing segments. Management's fourth-quarter revenue and earnings outlook highlighted operational strength that defies typical seasonal inventory drawdowns, reinforcing confidence in a broader semiconductor cycle recovery.
Market sentiment was further boosted by progress on the strategic corporate front. The company successfully priced two billion dollars in senior unsecured notes across four tranches to fund its strategic acquisition of Silicon Laboratories. Institutional investors reacted positively to the structured debt offering, which secures long-term fixed-rate financing to expand the company's mixed-signal integrated circuit capabilities while preserving cash reserves. This acquisition financing, alongside Texas Instruments' continued capital efficiency and support from federal CHIPS Act incentives, underscores management's execution in scaling manufacturing operations and executing targeted expansion.
Wall Street analysts responded with positive earnings estimate revisions, technical indicators pointed to a bullish breakout above key moving averages, and institutional demand supported share gains. Investor enthusiasm remains anchored by Texas Instruments' commitment to shareholder returns, evidenced by its twenty-third consecutive annual dividend increase and robust free cash flow generation. The combination of cyclical demand recovery, strategic inorganic growth through the Silicon Labs acquisition, and capital discipline continues to drive buy-side interest across the technology sector.
Technical Analysis of Texas Instruments Inc (TXN)
Technically, Texas Instruments Inc (TXN) shows a MACD (12,26,9) value of 3.106, indicating a buy signal. The RSI at 69.475 suggests neutral condition and the Williams %R at 0.695 suggests overbought condition. Please monitor closely.
Fundamental Analysis of Texas Instruments Inc (TXN)
Texas Instruments Inc (TXN) is in the Technology Equipment industry. Its latest annual revenue is $17.68B, ranking 14 in the industry. The net profit is $4.97B, ranking 10 in the industry. Company Profile
Over the past month, multiple analysts have rated the company as Buy, with an average price target of $321.20, a high of $400.00, and a low of $188.00.
More details about Texas Instruments Inc (TXN)
Company Specific Risks:
- Elevated Inventory and Premature Market Recovery Concerns: Institutional analysts highlighted that despite Q3 earnings beats, Texas Instruments continues to carry high inventory levels near 194 days of inventory (DOI), indicating that a broader cyclical recovery in the analog semiconductor market remains in its early stages and vulnerable to demand stalls.
- Capital Expenditure Intensity Dragging Free Cash Flow: Management confirmed that full-year capital expenditures will reach the upper end of its $2.0 billion to $3.0 billion target range—with up to $1.0 billion projected for Q4 alone to equip clean rooms—raising analyst concerns regarding structural cash flow drag and muted return on invested capital relative to capital-light peers.
- Valuation Premium and Downside Vulnerability: Following recent share price appreciation, the stock trades at an elevated trailing P/E ratio above 43x (well exceeding its 5-year median of 27.6x) and at an estimated 18.5% premium to intrinsic value, prompting analysts to warn of limited upside and heightened profit-taking risk.
- Supply Chain Bottlenecks in Consumer End-Markets: Management noted lingering component shortages and supply chain friction within the personal electronics segment, suppressing volume growth in consumer-facing chips relative to the stronger data center and industrial divisions.
This article may include AI-generated content that is human-reviewed, which is for reference and general information purposes only and does not constitute investment advice.
Recommended Articles








Comments (0)
Click the $ button, enter the symbol, and select to link a stock, ETF, or other ticker.