


Texas Instruments Inc Stock (TXN) Moved Up by 3.48% on Oct 26: A Full Analysis



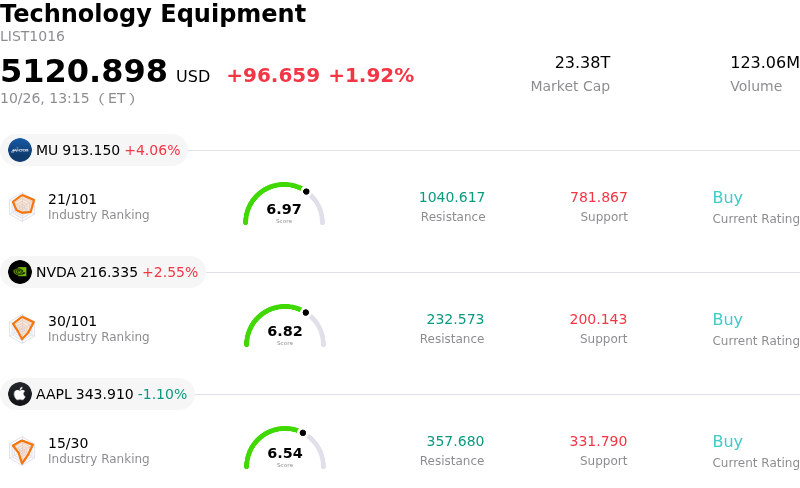
Texas Instruments Inc (TXN) moved up by 3.48%. The Technology Equipment sector is up by 1.92%. The company outperformed the industry. Top 3 stocks by turnover in the sector: Micron Technology Inc (MU) up 4.03%; NVIDIA Corp (NVDA) up 2.55%; Apple Inc (AAPL) down 1.10%.
What is driving Texas Instruments Inc (TXN)’s stock price up today?
Texas Instruments experienced upward momentum as investors continued to react positively to the company's stronger-than-expected third-quarter financial results and encouraging forward guidance. Top- and bottom-line figures comfortably surpassed consensus expectations, driven by accelerated broad-based demand across core end markets. Performance was notably boosted by hyper-growth in data center infrastructure, propelled by artificial intelligence expansion, alongside solid year-over-year sales gains in industrial applications and automotive sectors.
The rally was further fueled by Texas Instruments' upbeat revenue and earnings outlook for the fourth quarter, which defied typical seasonal inventory drawdowns and signaled a robust broader recovery in the analog semiconductor market. Wall Street analysts responded favorably by raising target prices, pointing to impressive gross and operating margin expansion, strong free cash flow generation supported by CHIPS Act incentives, and moderating capital expenditure intensity.
Although intraday volatility highlighted ongoing investor debate surrounding current valuation metrics and broader macroeconomic risks, market sentiment toward Texas Instruments remains constructive. Accelerating factory utilization, structural tailwinds from AI power-management applications, and a long-standing track record of shareholder capital returns—including its 23rd consecutive annual dividend hike—continue to underpin long-term institutional confidence in the stock.
Technical Analysis of Texas Instruments Inc (TXN)
Technically, Texas Instruments Inc (TXN) shows a MACD (12,26,9) value of 0.161, indicating a buy signal. The RSI at 62.636 suggests neutral condition and the Williams %R at 0.044 suggests overbought condition. Please monitor closely.
Fundamental Analysis of Texas Instruments Inc (TXN)
Texas Instruments Inc (TXN) is in the Technology Equipment industry. Its latest annual revenue is $17.68B, ranking 14 in the industry. The net profit is $4.97B, ranking 10 in the industry. Company Profile
Over the past month, multiple analysts have rated the company as Buy, with an average price target of $308.90, a high of $400.00, and a low of $184.59.
More details about Texas Instruments Inc (TXN)
Company Specific Risks:
- Elevated Capital Expenditure Commitments: Management confirmed following Q3 2026 earnings that full-year capital expenditures will reach the upper end of its $2.0 billion to $3.0 billion target range, with fourth-quarter capex projected between $900 million and $1.0 billion to equip idle clean room capacity, generating structural cash flow drag.
- Valuation Overhead and Analyst Target Trims: Institutional analysts, including UBS, trimmed price targets following the earnings report due to extended valuation multiples (trailing P/E above 35x), warning that the stock faces multiple compression if broad semiconductor growth moderates.
- Supply Chain Strain in Personal Electronics: Executive commentary during the earnings call highlighted lingering component shortages and supply chain pressures that continue to constrain personal electronics customers, suppressing consumer-facing chip volume relative to data center and industrial segments.
- Narrow Buffer in Q4 Guidance Expectations: Fourth-quarter revenue guidance of $5.80 billion to $6.30 billion reflects flat sequential growth at the midpoint, matching already-elevated buy-side expectations and leaving minimal buffer against operational execution missteps.
This article may include AI-generated content that is human-reviewed, which is for reference and general information purposes only and does not constitute investment advice.
Recommended Articles







Comments (0)
Click the $ button, enter the symbol, and select to link a stock, ETF, or other ticker.