


Applied Materials Inc Stock (AMAT) Moved Up by 3.67% on Oct 26: Key Drivers Unveiled



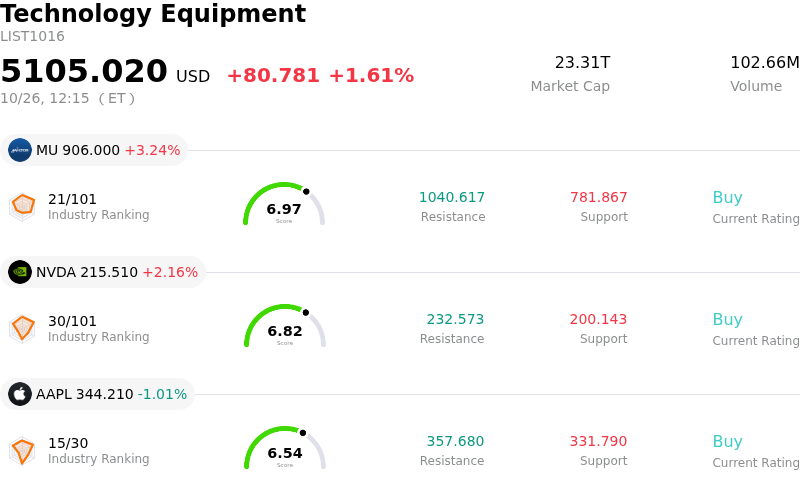
Applied Materials Inc (AMAT) moved up by 3.67%. The Technology Equipment sector is up by 1.61%. The company outperformed the industry. Top 3 stocks by turnover in the sector: Micron Technology Inc (MU) up 3.30%; NVIDIA Corp (NVDA) up 2.15%; Apple Inc (AAPL) down 1.01%.
What is driving Applied Materials Inc (AMAT)’s stock price up today?
Applied Materials experienced positive upside momentum and heightened intraday volatility as market participants actively engaged in opportunistic buying following recent sector-wide valuation compression. Investors seized upon an increasingly attractive entry point after prior pullbacks brought the company's valuation multiples down to more favorable levels. This institutional accumulation reflects a broader stabilization across the semiconductor equipment group as immediate concerns regarding artificial intelligence capital expenditure timing began to subside.
The upward price action is firmly supported by Applied Materials' critical role in powering next-generation semiconductor manufacturing. The company remains uniquely positioned to capture capital spending linked to advanced foundry and logic nodes, gate-all-around transistor structures, dynamic random-access memory, and high-bandwidth memory technologies vital for artificial intelligence workloads. Strong performance across its semiconductor systems unit and expanding gross margins highlight the resilience of its differentiated technology portfolio, providing a fundamental backstop against broader tech sector volatility.
Looking ahead, investor attention is turning toward the company's upcoming fiscal fourth-quarter earnings report. Wall Street consensus continues to view Applied Materials favorably, pointing to robust multi-year demand forecasts for wafer fabrication tools as global chipmakers execute long-term fab expansion plans. Although macro risk factors and international trade policy restrictions require ongoing evaluation, the intraday price movement highlights renewed market confidence in Applied Materials' long-term growth trajectory and cash flow generation capabilities.
Technical Analysis of Applied Materials Inc (AMAT)
Technically, Applied Materials Inc (AMAT) shows a MACD (12,26,9) value of -21.993, indicating a sell signal. The RSI at 32.024 suggests neutral condition and the Williams %R at 87.938 suggests oversold condition. Please monitor closely.
Media Coverage of Applied Materials Inc (AMAT)
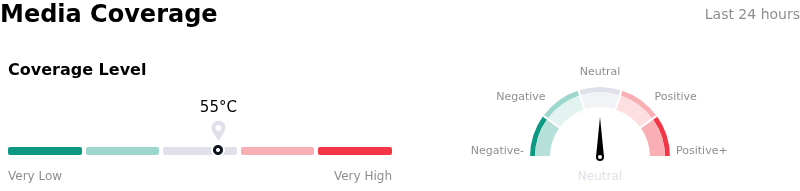
In terms of media coverage, Applied Materials Inc (AMAT) shows a coverage score of 55, indicating a moderate level of media attention. The overall market sentiment index is currently in neutral zone.
Fundamental Analysis of Applied Materials Inc (AMAT)
Applied Materials Inc (AMAT) is in the Technology Equipment industry. Its latest annual revenue is $28.37B, ranking 11 in the industry. The net profit is $7.00B, ranking 8 in the industry. Company Profile
Over the past month, multiple analysts have rated the company as Buy, with an average price target of $626.32, a high of $900.00, and a low of $308.00.
More details about Applied Materials Inc (AMAT)
Company Specific Risks:
- Supply-Chain Bottleneck Spillovers: Recent warnings from key equipment peer Lam Research regarding persistent component shortages and cleanroom capacity constraints extending into 2027 have triggered broad sector sell-offs, accentuating institutional fears that Applied Materials may face capped tool output and shipment delays.
- Lack of Top-Line Target Visibility: Institutional analysts highlighted key risks following management's long-term financial presentation, which established 2030 gross and operating margin goals but notably omitted explicit total revenue forecasts and wafer-fab equipment spending benchmarks.
- Intensified China Export Controls: Tightened U.S. Department of Commerce Bureau of Industry and Security rules targeting foreign affiliates further restrict the export of advanced semiconductor tools and maintenance services to key Chinese clients, directly threatening a market that historically generates up to 30% of total company revenue.
- Customer Concentration and AI Capex Vulnerability: Heavy customer reliance, with two main buyers representing approximately 34% of year-to-date sales, leaves the business exposed to sharp financial downside if leading foundries scale back artificial intelligence capital expenditure or experience downstream data center buildout delays.
This article may include AI-generated content that is human-reviewed, which is for reference and general information purposes only and does not constitute investment advice.
Recommended Articles








Comments (0)
Click the $ button, enter the symbol, and select to link a stock, ETF, or other ticker.