


Solana (SOLUSD) Is down 1.05% on Oct 26: Here Is Why



Solana (SOLUSD) is down 1.05% at Oct 26 22:40(ET), now at $99.62, with a 7-day down of 3.80%.
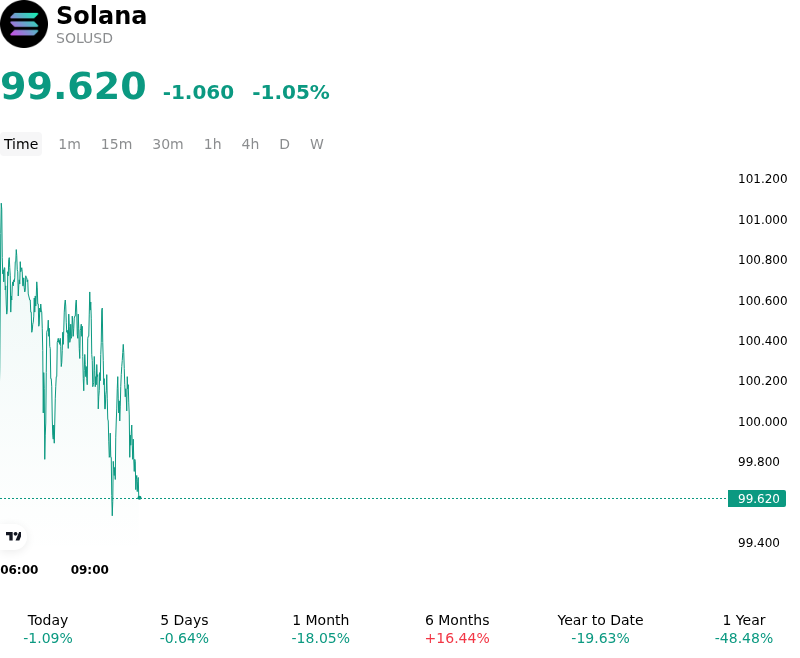
What is driving Solana (SOLUSD)’s stock price down today?
Institutional liquidity conditions weighed on Solana as persistent net outflows from spot Solana exchange-traded products continued to suppress buy-side momentum. The recent mainnet activation of the Alpenglow upgrade—which dramatically reduced transaction finality to roughly 150 milliseconds—triggered a classic sell-the-news reaction among tactical market participants. Investors who had positioned ahead of the long-anticipated protocol milestone used the deployment window to reduce risk and realize short-term gains, resulting in an absence of immediate follow-through demand despite the fundamental performance improvement.
Broader macroeconomic headwinds further restricted risk appetite across the digital asset space. Rising Treasury yields and lingering caution surrounding the Federal Reserve’s upcoming monetary policy meeting prompted institutional capital to rotate toward defensive positions, elevating Bitcoin dominance at the expense of major altcoins. In perpetual futures markets, the combination of lighter spot depth and localized leverage unwinding accelerated downside pressure as underwater long positions encountered stop-loss clusters near key support thresholds.
While institutional adoption channels continue to expand, including tokenized money market fund initiatives and international product listings, market participants remain cautious in the near term. The primary structural test for Solana remains its ability to translate technical efficiency gains from recent network enhancements into sustained application layer revenues and expanded economic activity. Until spot ETF flows stabilize and broader macro risk sentiment clears, Solana remains susceptible to technical consolidations and liquidity-driven pullbacks.
Technical Analysis of Solana (SOLUSD)
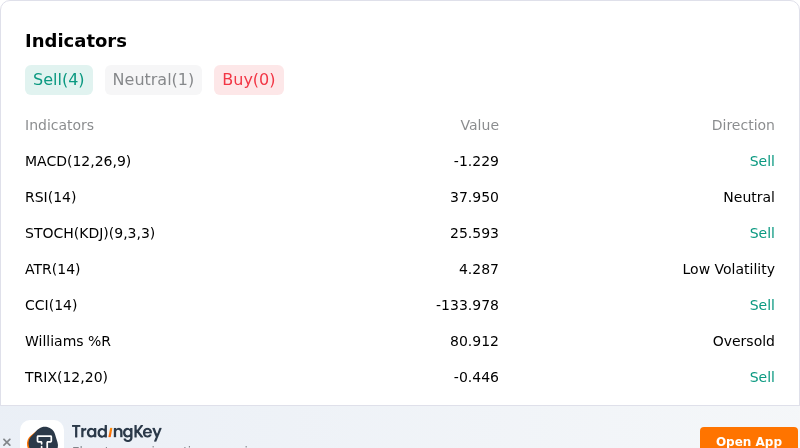
Technically, Solana (SOLUSD) shows a MACD (12,26,9) value of -1.211, indicating a sell signal. The RSI at 38.142 suggests neutral condition and the Williams %R at 79.582 suggests sell condition. Please monitor closely.
More details about Solana (SOLUSD)
Recent Events and Risks:
- Leveraged Long Liquidations: Solana perpetual futures experienced an aggressive unwinding phase following a broader market contraction, with multi-million-dollar forced long liquidations triggered as heavily long-skewed leverage was flushed out.
- Persistent Spot ETF Net Outflows: U.S. spot Solana exchange-traded funds recorded ongoing net redemptions—including single-day outflows exceeding $8.5 million—marking their deepest multi-day capital withdrawal streak of 2026 and reducing structural institutional buy-side support.
- Exchange-Bound Whale Deposits: On-chain tracking revealed substantial exchange-bound transfers from large holders, including over 470,000 SOL (valued at over $51 million) transferred to Coinbase, increasing immediate spot market supply overhang and potential sell-side pressure.
- Post-Upgrade "Sell-the-News" Technical Vulnerability: Following the mainnet deployment of the Alpenglow consensus upgrade, price action triggered a "sell-the-news" retracement beneath key exponential moving averages, threatening critical psychological support near $100 and raising the risk of cascading stop-loss liquidations.
This article may include AI-generated content that is human-reviewed, which is for reference and general information purposes only and does not constitute investment advice.
Recommended Articles










Comments (0)
Click the $ button, enter the symbol, and select to link a stock, ETF, or other ticker.