


XRP (XRPUSD) Is down 1.27% on Oct 25: Why It Happened



XRP (XRPUSD) is down 1.27% at Oct 25 20:55(ET), now at $1.2913, with a 7-day up of 2.17%.
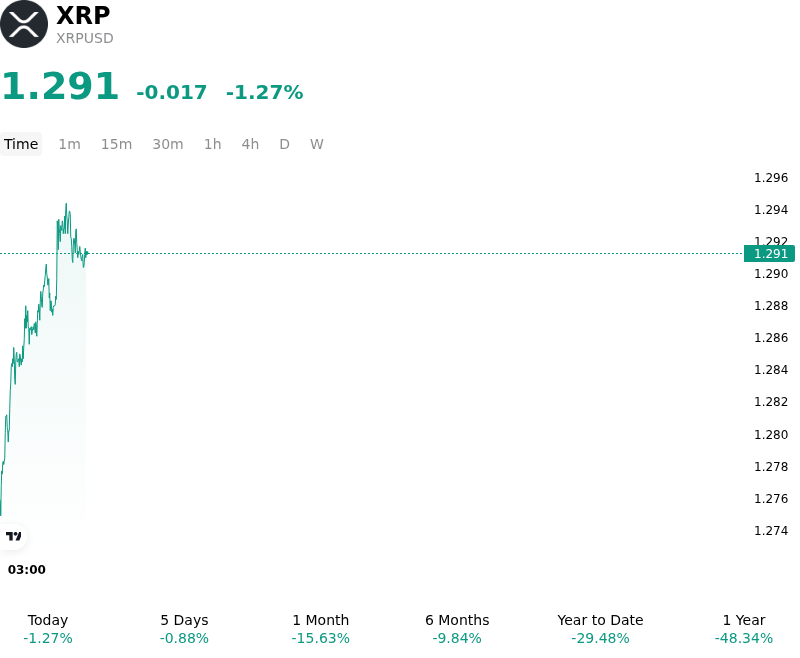
What is driving XRP (XRPUSD)’s stock price down today?
The downside pressure on XRP reflects a combination of broader digital-asset market consolidation and tightening short-term risk sentiment across the altcoin complex. Macroeconomic headwinds, driven by elevated energy prices and sticky inflation metrics, have sustained high Treasury yields and reinforced market expectations for a prolonged restrictive policy stance from the Federal Reserve. This environment reduced institutional risk appetite for higher-beta digital assets, leading investors to reduce exposure and shift capital toward relative safety.
Asset-specific dynamics further weighed on price momentum as daily capital inflows into spot XRP exchange-traded funds stagnated, failing to provide the institutional bid necessary to absorb secondary market liquidity. The lack of sustained fund accumulation coincided with market sensitivity around scheduled monthly escrow unlocks, which periodically introduce supply overhang concerns and encourage defensive positioning among traders. While long-term adoption narratives remain supported by institutional interest around Ripple Prime and upcoming industry events like Swell 2026, the absence of immediate spot ETF purchasing power left the token vulnerable to technical resistance.
In the derivatives market, forced liquidations of leveraged long positions across the broader cryptocurrency sector amplified sell-side momentum. As open interest contracted and funding rates adjusted, the unwinding of long leverage pressured short-term price levels. Until institutional ETF flows resume consistent net accumulation and macroeconomic liquidity conditions ease, XRP remains sensitive to broader market sentiment and leverage-driven rebalancing.
Technical Analysis of XRP (XRPUSD)
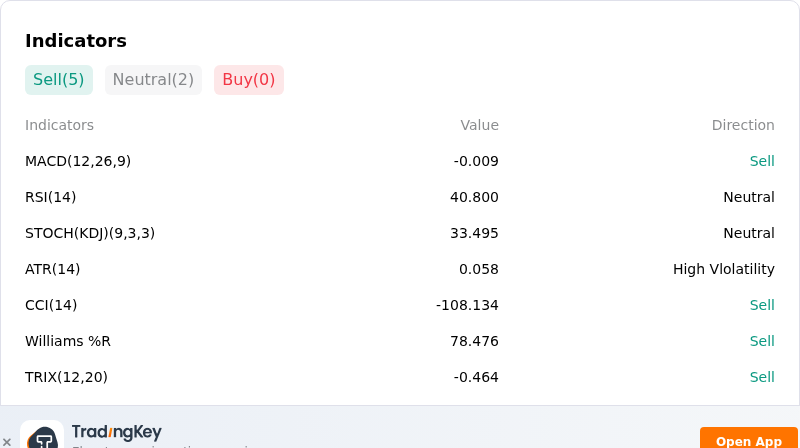
Technically, XRP (XRPUSD) shows a MACD (12,26,9) value of -0.009, indicating a sell signal. The RSI at 40.800 suggests neutral condition and the Williams %R at 78.476 suggests sell condition. Please monitor closely.
More details about XRP (XRPUSD)
Recent Events and Risks:
- Severe Long Liquidation Cascade: A sharp market-wide downturn triggered a 2,008% liquidation imbalance for XRP derivatives, forcing $7.55 million in long position unwinds out of $7.92 million in total liquidations and driving the price below key support to $1.27.
- Elevated Exchange Whale Inflows: On-chain data shows that average monthly XRP whale deposits to Binance surged to $112.4 million—a seven-month high—accompanied by 6.05 billion XRP landing on centralized exchanges over a 30-day window, significantly increasing available spot selling pressure.
- Multi-Year Low in Whale Accumulation Outflows: Binance 90-day average whale outflows plunged to a five-year low of $49.7 million, reflecting a substantial reduction in institutional accumulation and leaving high exchange reserves vulnerable to downside market shocks.
- Derivatives De-risking and Support Breakdown: The estimated XRP leverage ratio on Binance tumbled 26.2% as futures traders aggressively trimmed exposure, causing the token to break beneath its crucial $1.28 to $1.30 technical floor and raising the risk of extended downside.
This article may include AI-generated content that is human-reviewed, which is for reference and general information purposes only and does not constitute investment advice.
Recommended Articles







Comments (0)
Click the $ button, enter the symbol, and select to link a stock, ETF, or other ticker.