


Solana (SOLUSD) Suddenly Goes down 2.26% on Oct 25: What You Need to Watch



Solana (SOLUSD) is down 2.26% at Oct 25 20:45(ET), now at $100.58, with a 7-day up of 0.36%.
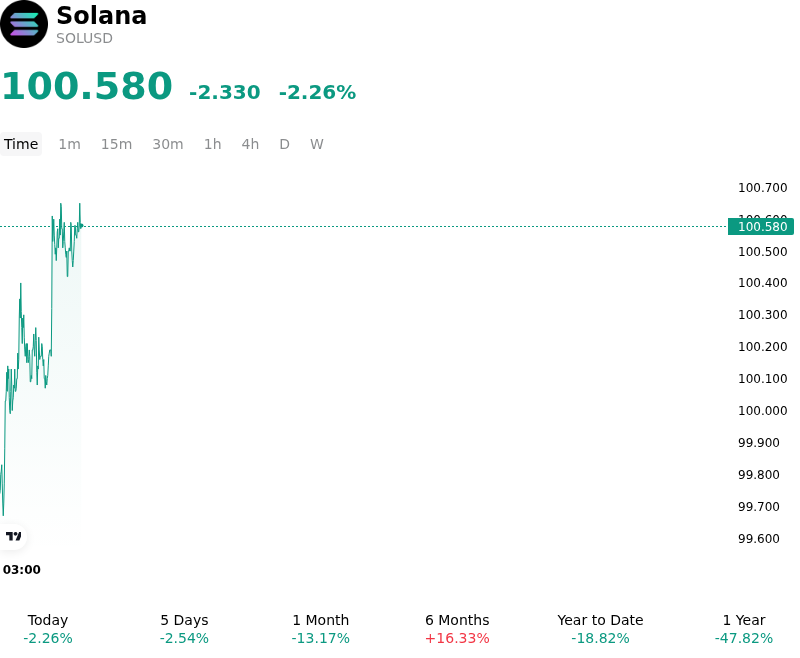
What is driving Solana (SOLUSD)’s stock price down today?
The downward price action in Solana reflects a confluence of macroeconomic risk aversion, institutional flow moderation, and leveraged derivatives liquidations across the broader digital asset market. Elevated global energy prices and persistent inflation concerns have driven U.S. Treasury yields higher, dampening broader appetite for risk assets ahead of upcoming Federal Reserve monetary policy deliberations. As benchmark cryptocurrencies encountered selling pressure, capital rotated defensively toward lower-volatility holdings and stablecoins, causing Bitcoin market dominance to rise while higher-beta smart contract platforms faced heightened selling pressure.
Institutional demand signals for Solana weakened as spot Solana exchange-traded funds recorded net outflows over recent sessions. The pause in institutional accumulation removed a primary driver of spot market liquidity that had previously provided structural price support. Without consistent fund inflows to offset profit-taking and secondary market distribution, order book depth thinned, amplifying the impact of spot selling across major exchanges.
Derivatives positioning further compounded the decline. As prices broke through key technical support thresholds, a wave of automated long liquidations was triggered in the futures market. This forced unwinding of leveraged long positions created short-term selling cascades, temporarily accelerating downside momentum.
From a structural perspective, the pullback represents a market-wide liquidity repricing and leverage flush rather than a deterioration in underlying protocol fundamentals. Solana continues to expand its institutional footprint through advancements in tokenized real-world assets, institutional custody expansion, and cross-border payment ecosystem integrations. In the immediate term, market participants remain focused on macroeconomic liquidity conditions, monetary policy expectations, and the stabilization of institutional fund flows.
Technical Analysis of Solana (SOLUSD)
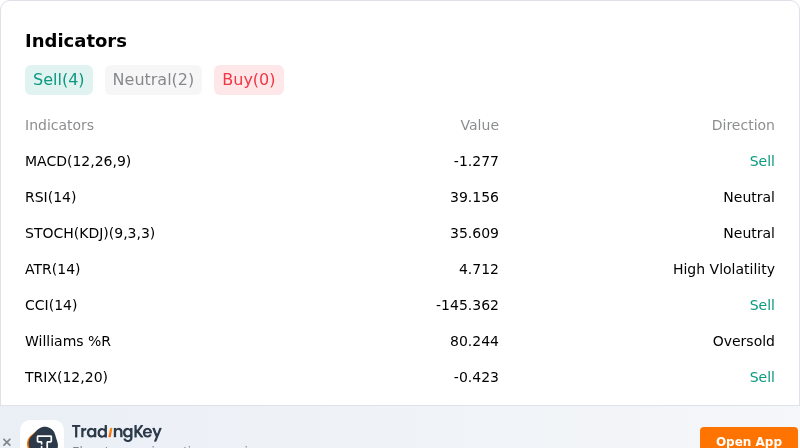
Technically, Solana (SOLUSD) shows a MACD (12,26,9) value of -1.277, indicating a sell signal. The RSI at 39.156 suggests neutral condition and the Williams %R at 80.244 suggests oversold condition. Please monitor closely.
More details about Solana (SOLUSD)
Recent Events and Risks:
- Leveraged Long Liquidation Cascade: SOL perpetual futures face heightened intraday downside risk following a purge of heavily long-skewed derivative positions, with forced long liquidations accelerating market pressure as price action tests critical technical support near $100.32.
- Sustained Spot ETF Capital Outflows: US spot Solana exchange-traded funds have recorded persistent net withdrawals, reaching their deepest 7-day average outflow reading of 2026 and significantly weakening institutional buy-side support.
- Whale Exchange Transfers and Supply Overhang: On-chain data indicates large wallet unstaking activity alongside transfers exceeding 470,000 SOL to centralized exchange deposit addresses, creating an immediate spot sell-side distribution overhang.
- Post-Upgrade "Sell-the-News" Deleveraging: The mainnet activation of the Alpenglow consensus upgrade triggered immediate profit-taking and systematic futures open-interest contractions as market participants unwound risk exposure near overhead moving average resistance.
This article may include AI-generated content that is human-reviewed, which is for reference and general information purposes only and does not constitute investment advice.
Recommended Articles







Comments (0)
Click the $ button, enter the symbol, and select to link a stock, ETF, or other ticker.