


Tesla Inc Stock (TSLA) Closed Down by 3.08% on Oct 22: What Signal Does It Send?



Tesla Inc (TSLA) closed down by 3.08%. The Automobiles & Auto Parts sector is down by 1.52%. The company underperformed the industry. Top 3 stocks by turnover in the sector: Tesla Inc (TSLA) down 3.08%; General Motors Co (GM) up 1.45%; Cummins Inc (CMI) down 4.18%.
What is driving Tesla Inc (TSLA)’s stock price down today?
Tesla experienced downward pressure following the release of its third-quarter financial results. Although the company managed a slight beat on adjusted bottom-line earnings and delivered positive free cash flow, market sentiment was tempered by flat year-over-year revenue and a steep decline in high-margin automotive regulatory credit sales. Investor disappointment was further exacerbated by management lowering its full-year capital expenditure forecast, raising concerns among institutional investors that investment momentum behind artificial intelligence, autonomous driving, and robotics compute infrastructure may be slowing down.
The reduction in capital outlay targets created mixed reactions across Wall Street. While reduced near-term spending provided immediate relief to cash balances, equity analysts pointed out that scaling artificial intelligence compute, Optimus humanoid robot production, and driverless taxi fleets requires aggressive and continuous capital deployment. Furthermore, regulatory scrutiny and approval timelines in key international markets, combined with extended operational ramp schedules for next-generation hardware, added friction to valuation frameworks that heavily factor in non-automotive technology catalysts.
Uncertainties surrounding prospective corporate strategic actions, including chatter regarding potential inter-company combinations, also contributed to cautious trading as executives declined to offer fresh specifics during the post-earnings conference call. Meanwhile, ongoing competitive dynamics in the global electric vehicle sector and softening vehicle delivery growth continue to put pressure on core automotive margins. Given the company's elevated valuation multiple relative to traditional original equipment manufacturers, any signal of deferred capital allocation toward high-growth software and hardware initiatives exposes the stock to short-term repricing.
Technical Analysis of Tesla Inc (TSLA)
Technically, Tesla Inc (TSLA) shows a MACD (12,26,9) value of 0.114, indicating a buy signal. The RSI at 52.804 suggests neutral condition and the Williams %R at 36.097 suggests buy condition. Please monitor closely.
Media Coverage of Tesla Inc (TSLA)
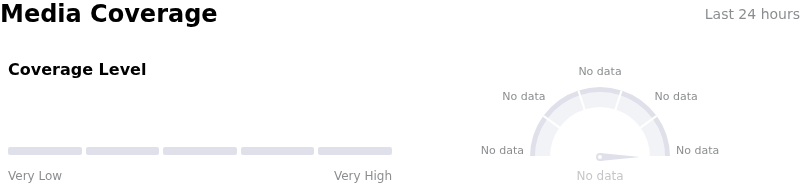
In terms of media coverage, Tesla Inc (TSLA) shows a coverage score of 88, indicating a very high level of media attention. The overall market sentiment index is currently in bullish zone.
Fundamental Analysis of Tesla Inc (TSLA)
Tesla Inc (TSLA) is in the Automobiles & Auto Parts industry. Its latest annual revenue is $94.83B, ranking 6 in the industry. The net profit is $3.79B, ranking 2 in the industry. Company Profile
Over the past month, multiple analysts have rated the company as Buy, with an average price target of $383.18, a high of $550.00, and a low of $24.86.
More details about Tesla Inc (TSLA)
Company Specific Risks:
- Severe Operating Profit & Net Income Contraction: In its Q3 2026 earnings release, Tesla disclosed a 43% year-over-year decline in GAAP net income to $787 million and a 56% drop in operating income to $718 million, driven by a 39% surge in operating expenses and a 3% contraction in core automotive revenue to $20.56 billion.
- Capital Expenditure Guidance Cut in Form 10-Q: Tesla reduced its full-year 2026 capital expenditure target in its Q3 Form 10-Q filing to approximately $20 billion—down from previous guidance of over $25 billion—raising institutional concerns over capital constraints and potential delays in scaling AI compute infrastructure, Cybercab, and Optimus projects.
- Automotive and Energy Storage Sales Disappointments: Automotive revenue fell 3% year-over-year due to declining average vehicle selling prices and battery supply bottlenecks, regulatory credit sales dropped 73% to $113 million, and energy storage deployments missed Wall Street expectations by coming in at 13.7 GWh versus the 15.9 GWh consensus.
- Autonomy Execution & Regulatory Scrutiny: Management delivered cautious conference call commentary acknowledging delayed timelines for Optimus mass production alongside persistent regulatory hurdles for robotaxis, reinforced by an NHTSA probe into robotaxi operations in school zones.
This article may include AI-generated content that is human-reviewed, which is for reference and general information purposes only and does not constitute investment advice.
Recommended Articles








Comments (0)
Click the $ button, enter the symbol, and select to link a stock, ETF, or other ticker.