


Ge Vernova Inc Stock (GEV) Moved Down by 11.64% on Oct 22: What Signal Does It Send?



Ge Vernova Inc (GEV) moved down by 11.64%. The Utilities sector is down by 0.81%. The company underperformed the industry. Top 3 stocks by turnover in the sector: Ge Vernova Inc (GEV) down 11.60%; Vistra Corp (VST) down 9.96%; Nextera Energy Inc (NEE) up 3.29%.
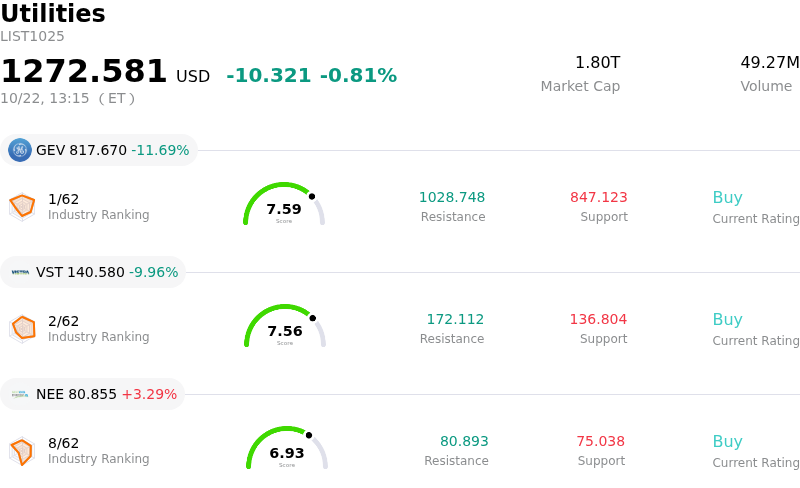
What is driving Ge Vernova Inc (GEV)’s stock price down today?
GE Vernova experienced significant downward pressure driven by a sector-wide pullback across artificial intelligence infrastructure and power equipment plays. As broader markets digested heightened volatility among high-beta tech-adjacent equities, institutional investors engaged in tactical profit-taking across grid infrastructure and energy transition providers. Because the company's valuation had expanded significantly on optimistic projections surrounding utility upgrades and surging electricity demand from data centers, high-multiple power names proved particularly sensitive to broad market position trimming.
Heightened caution ahead of the company's upcoming third-quarter financial release further amplified the downside momentum. Wall Street analysts recently recalibrated price targets downward, signaling sell-side prudence and setting demanding hurdle rates for margin performance. Given the stock's multi-quarter run-up, institutional portfolio managers chose to de-risk holdings ahead of the report to protect gains, leading to increased intraday selling volume.
Fundamental concerns regarding segment margin balance also weighed on investor sentiment. Although the Power and Electrification units continue to benefit from robust global demand and a substantial order backlog, persistent profitability drags within the Wind segment remain a focal point. Slower project execution and elevated offshore contract costs have maintained pressure on consolidated profitability, making investors hesitant to hold aggressive positions until clear operational recovery materializes.
Technical Analysis of Ge Vernova Inc (GEV)
Technically, Ge Vernova Inc (GEV) shows a MACD (12,26,9) value of -30.010, indicating a sell signal. The RSI at 30.305 suggests neutral condition and the Williams %R at 99.634 suggests oversold condition. Please monitor closely.
Media Coverage of Ge Vernova Inc (GEV)
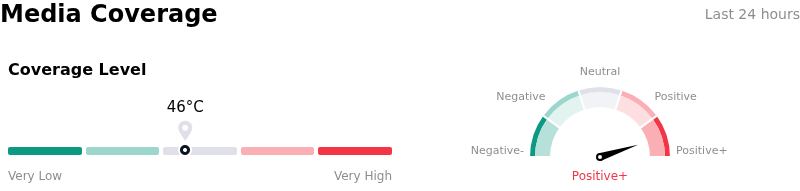
In terms of media coverage, Ge Vernova Inc (GEV) shows a coverage score of 46, indicating a moderate level of media attention. The overall market sentiment index is currently in extremely bullish zone.
Fundamental Analysis of Ge Vernova Inc (GEV)
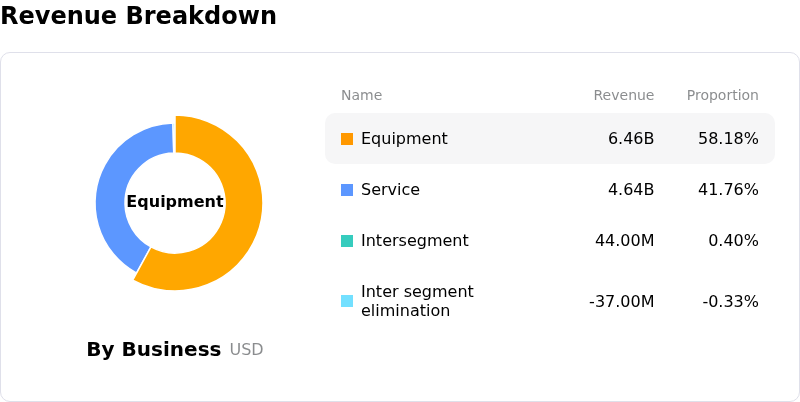
Ge Vernova Inc (GEV) is in the Utilities industry. Its latest annual revenue is $38.07B, ranking 2 in the industry. The net profit is $4.88B, ranking 4 in the industry. Company Profile
Over the past month, multiple analysts have rated the company as Buy, with an average price target of $1183.75, a high of $1450.00, and a low of $470.00.
More details about Ge Vernova Inc (GEV)
Company Specific Risks:
- Analyst Price Target Reductions Ahead of Earnings: Major Wall Street research firms, including JPMorgan and Susquehanna, have recently lowered their price targets on GEV due to valuation concerns and caution surrounding execution risks ahead of the upcoming Q3 earnings release.
- Persistent Wind Segment Operational Drag: GEV's Wind division continues to suffer from operational challenges and EBITDA losses, serving as a drag on overall margin expansion despite solid growth across the Power and Electrification segments.
- High Valuation Multiple and AI Sentiment Sensitivity: GEV trades at a premium valuation multiple heavily reliant on sustained AI data-center electrification demand, leaving the stock vulnerable to sharp intraday pullbacks when macroeconomic yields rise or tech capex spending sentiment cools.
- Institutional and Insider Stake Trimming: Recent SEC filings and Form 13F disclosures report share sales by corporate executives alongside position trimming by prominent institutional managers, placing downward supply pressure on the stock during volatile sessions.
This article may include AI-generated content that is human-reviewed, which is for reference and general information purposes only and does not constitute investment advice.
Recommended Articles









Comments (0)
Click the $ button, enter the symbol, and select to link a stock, ETF, or other ticker.