


Eli Lilly and Co Stock (LLY) Moved Up by 3.37% on Oct 22: What Investors Need To Know



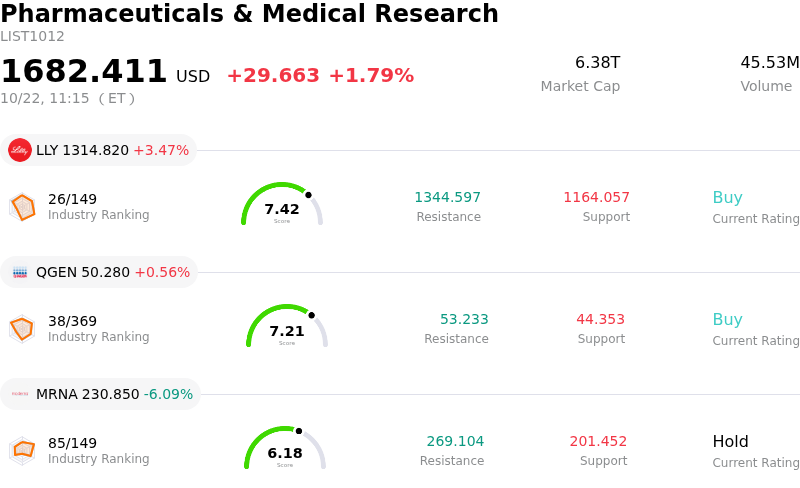
Eli Lilly and Co (LLY) moved up by 3.37%. The Pharmaceuticals & Medical Research sector is up by 1.79%. The company outperformed the industry. Top 3 stocks by turnover in the sector: Eli Lilly and Co (LLY) up 3.50%; Qiagen NV (QGEN) up 0.56%; Moderna Inc (MRNA) down 6.09%.
What is driving Eli Lilly and Co (LLY)’s stock price up today?
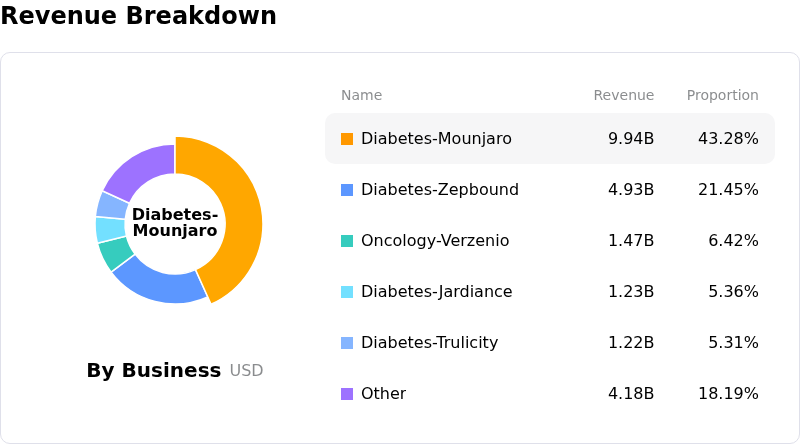
Eli Lilly experienced upward momentum driven by bullish institutional analyst updates ahead of its upcoming third-quarter financial results. Wall Street research teams, including Goldman Sachs and Bank of America, raised their target prices for the stock, forecasting a strong earnings beat and a potential upward revision to full-year guidance. Analysts highlighted accelerating international demand for diabetes treatment Mounjaro alongside steady volume gains for obesity drug Zepbound, which continue to benefit from expanding patient access programs like Medicare coverage.
The positive sentiment was further bolstered by strategic capital investments aimed at scaling manufacturing to keep pace with demand. The company broke ground on a multi-billion-dollar active pharmaceutical ingredient production facility in Virginia while establishing international packaging and manufacturing agreements in Abu Dhabi. Concurrently, market participants remain focused on pipeline advancements, including next-generation metabolic candidates such as retatrutide and oral treatment Foundayo, alongside label expansion progress for immunology therapy Omvoh following favorable Phase 3 clinical data.
From a broader market perspective, sector rotation out of high-valuation technology equities into established healthcare leaders provided additional tailwinds for the stock. This influx of capital propelled shares near historic levels, triggering elevated intraday trading volatility as institutional rebalancing interacted with momentum trading. While long-term growth trends remain firmly rooted in Eli Lilly's dominant GLP-1 franchise, premium valuation multiples and heightened market expectations leave the stock subject to short-term fluctuations ahead of official earnings commentary.
Technical Analysis of Eli Lilly and Co (LLY)
Technically, Eli Lilly and Co (LLY) shows a MACD (12,26,9) value of 27.279, indicating a buy signal. The RSI at 71.485 suggests buy condition and the Williams %R at 0.399 suggests overbought condition. Please monitor closely.
Media Coverage of Eli Lilly and Co (LLY)
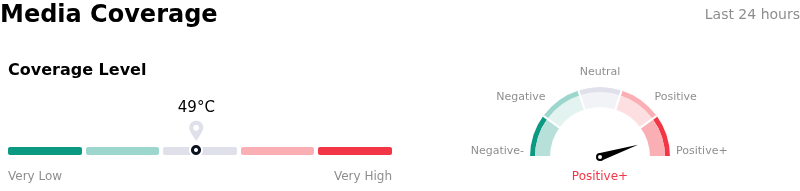
In terms of media coverage, Eli Lilly and Co (LLY) shows a coverage score of 49, indicating a moderate level of media attention. The overall market sentiment index is currently in extremely bullish zone.
Fundamental Analysis of Eli Lilly and Co (LLY)
Eli Lilly and Co (LLY) is in the Pharmaceuticals & Medical Research industry. Its latest annual revenue is $65.18B, ranking 4 in the industry. The net profit is $20.64B, ranking 2 in the industry. Company Profile
Over the past month, multiple analysts have rated the company as Buy, with an average price target of $1316.96, a high of $1600.00, and a low of $891.22.
More details about Eli Lilly and Co (LLY)
Company Specific Risks:
- Severe Valuation Premium: Wall Street consensus and Morningstar research indicate that Eli Lilly trades at a premium of roughly 30% over its $980 fair value estimate, leaving the stock exposed to severe pullbacks if upcoming Q3 earnings on October 29 fall short of aggressive growth forecasts.
- Post-Peak Profit Taking and Resistance: After hitting a new all-time high of $1,311.21 on October 20, the stock experienced immediate selling pressure and intraday exhaustion, pulling back below $1,271 as technical indicators flag overbought conditions.
- Persistent Heavy Insider Liquidations: Regulatory updates reveal zero insider stock purchases over the past 12 months against over $2.66 billion in insider sales, demonstrating ongoing executive disposition near record valuation levels.
- GLP-1 Pricing and Margin Pressures: Expanding access under Medicare programs and intense market share competition from Novo Nordisk are squeezing average selling prices, creating execution risk around revenue targets for key incretin franchises Mounjaro and Zepbound.
This article may include AI-generated content that is human-reviewed, which is for reference and general information purposes only and does not constitute investment advice.
Recommended Articles









Comments (0)
Click the $ button, enter the symbol, and select to link a stock, ETF, or other ticker.